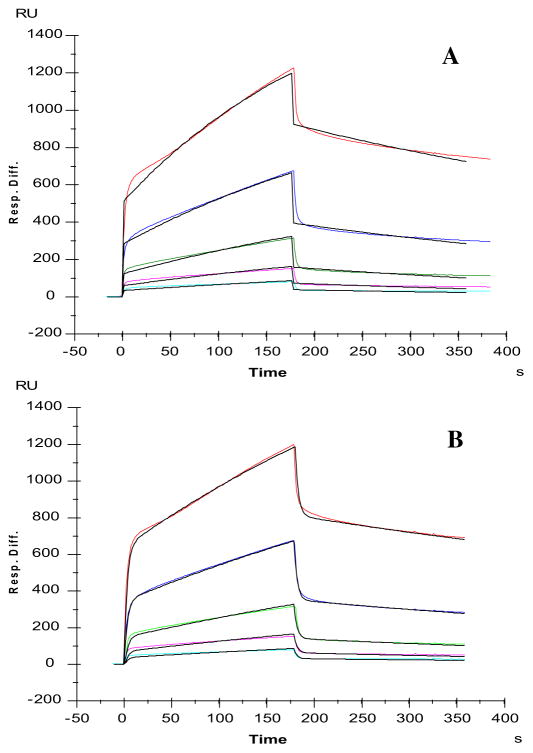
Fig. 2.
SPR sensorgrams of Robo1–heparin interaction. Concentrations of Robo1 (from top to bottom): 1000, 500, 250, 125 and 63 nM, respectively. A: Fitting with a Langmuir 1:1 binding model; B: Fitting with a two stages binding (conformation change) model. The black curves are the fitting curves using models from BIAevaluate 4.0.1.

