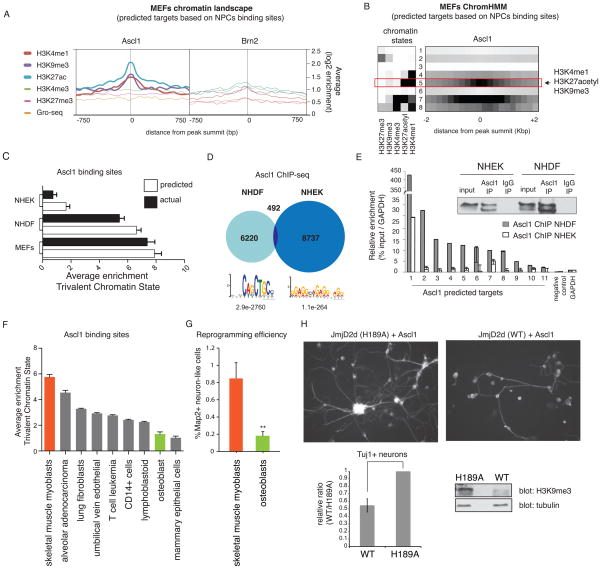
Figure 6. A trivalent chromatin state is characteristic and predictive of Ascl1 chromatin accessibility between different cell types.
(A) Average enrichment of individual histone marks in uninfected MEFs at the sites where Ascl1 (left) or Brn2 (right) is bound in NPCs. For each binding site, the signal is displayed +/− 750bp from peak summit.
(B) MEFs chromatin states based on ChromHMM analysis. Heat map of chromatin states enrichment within −2/+2 kb from Ascl1 binding site in NPCs. Arrow highlights most differentially enriched state between Ascl1 and Brn2 binding sites specified as state #5 (trivalent chromatin state = H3K4me1, H3K27acetyl, and H3K9me3).
(C) Average enrichment of trivalent chromatin state at predicted Ascl1 bound sites across cell types based on Ascl1 binding in NPCs (white columns). In black columns are represented the average enrichment for trivalent chromatin state at Ascl1 bound sites from Ascl1 ChIP-seq in MEFs, NHDF, and NHEK overexpressing cells. NHDF= normal human dermal fibroblasts; NHEK= normal human epidermal keratinocytes. Error bars = SEM.
(D) Venn diagram representing Ascl1 ChIP-seq peak overlap between targets in NHDF and NHEK cells. Bottom: Motif enriched in most confident thousand peaks.
(E) Left: Ascl1 ChIP-qPCR at predicted Ascl1 target genes in NHDF and NHEK cells overexpressing Ascl1 reveals substantially better binding in fibroblasts than keratinocytes. Right: Validation of equivalent pull-down efficiency of Ascl1 in NHEK and NHDF cells by ChIP followed by immunoblotting against Ascl1. Error bars = standard deviation of the ΔCT
(F) Average enrichment of trivalent chromatin state at predicted Ascl1 bound sites based on Ascl1 binding in NPCs across Encode cell types with chromatin data publicly available. In orange is the highest enrichment scores predicted for Ascl1-mediated reprogramming in human skeletal muscle myoblasts. In green is one of the lowest enrichment scores predicted for Ascl1-mediated reprogramming in human osteoblasts. Error bars = SEM.
(G) iN cell conversion efficiency expressed as ratio of neuronal, MAP2+ cells/ seeded cells in skeletal muscle myoblasts and osteoblasts infected with Ascl1, Brn2, Myt1l and NeuroD1. Measurements were carried out 20 days after induction of transgenes. A t-test was performed to compare reprogramming efficiencies of the two cell types (Error bars = SEM, n = 3 biological replicates, **p < 0.01).
(H) Characterization of Ascl1-mediated reprogramming upon global loss of H3K9me3 by overexpression of wild type (WT) or catalytically mutant (H189A) JmjD2d. Left: Tuj1 staining of MEFs expressing WT or H189A JmjD2d after Ascl1 induction for 11 days. Right: Fraction of Tuj1 positive neurons in WT relative to mutant (H189A) JmjD2d overexpressing MEFs. Bottom: Detection of H3K9me3 levels by immunoblot. Error bars = SEM, n = 3 biological replicates.
See also Figure S6.

