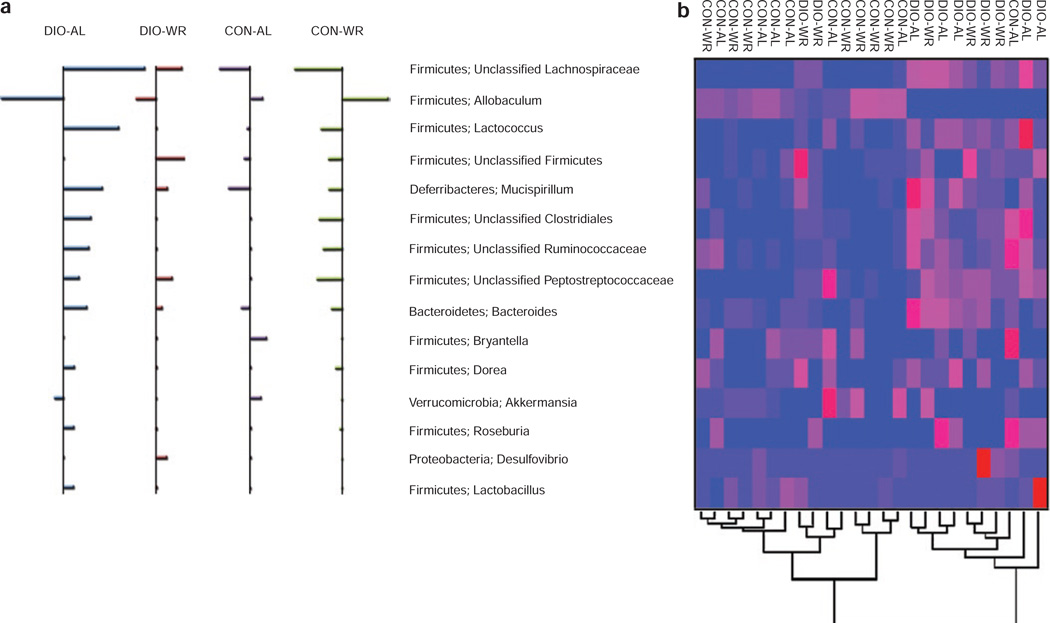
Figure 2.
Members of the microbiota that differ in abundance by diet composition and treatment (WR vs. AL). (a) Nearest shrunken centroid analysis of the 15 OTUs accounting for the differences among the four groups of mice. For each OTU listed in center, direction of the horizontal bars indicates relatively over-represented (right of vertical line) and under-represented (left of vertical line); the length of the bar indicates the strength of the effect. (b) Heat map of the “classifying” OTUs. Columns show, for each mouse, the abundance data of OTUs listed in center. The abundances of the OTUs were clustered using unsupervised hierarchical clustering (blue, low abundance; red, high abundance). The Phylum, Genus of each of the classifying OTUs is noted. AL, ad-libitum diets; OTU, relative operational taxonomic unit; WR, weight-reduced.

