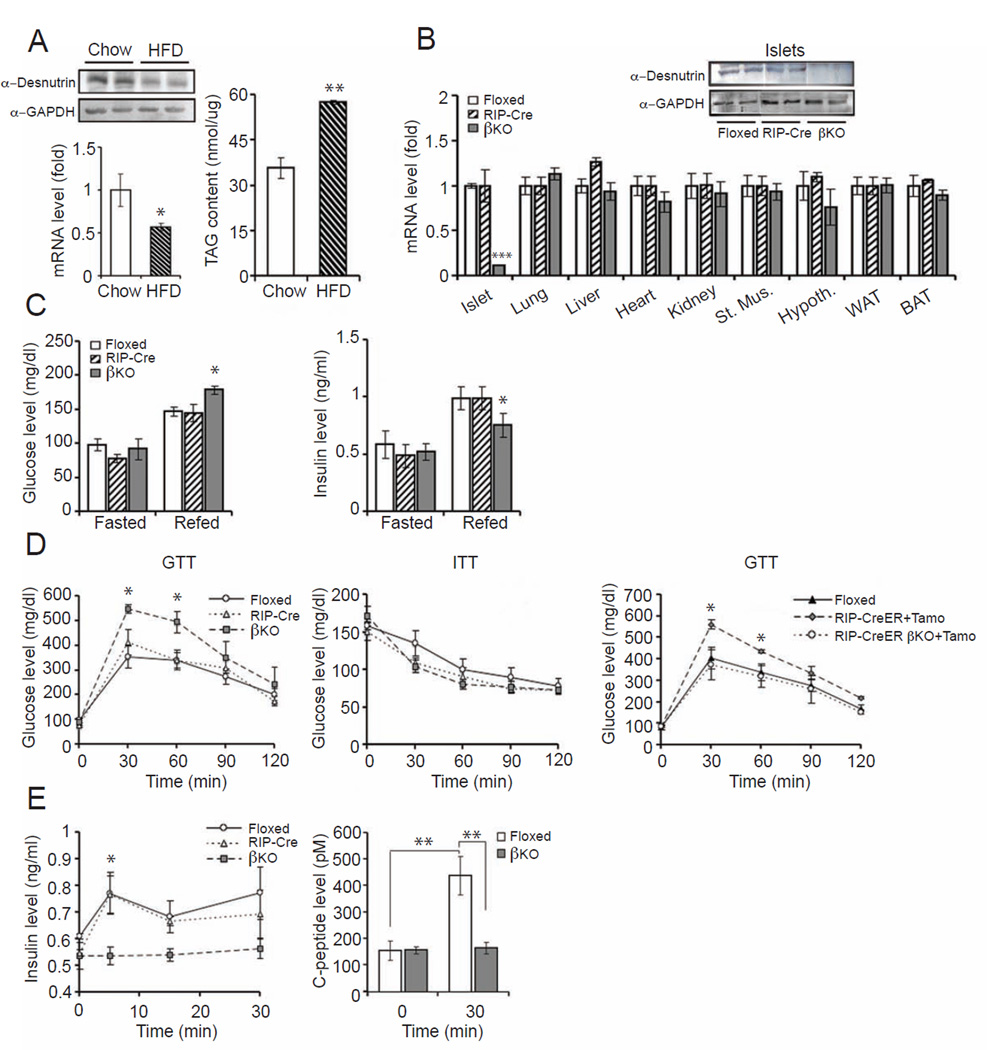
Figure 1.
GTT and ITT in desnutrin βKO mice. A) Immunoblotting (left top) and RT-qPCR for desnutrin (left bottom) in pancreatic islets of C57BL/6 mice; TAG content in pancreatic islets (right). B) Immunoblotting (top) and RT-qPCR (bottom) for desnutrin expression in islets. C) Blood glucose and plasma insulin levels in mice. D) GTT (left) and ITT in mice (middle), and GTT in RIP-CreER mice treated with tamoxifen (right). E) Plasma insulin (left) and C-peptide levels (right) during GTT. Male mice, n=6–10. Data are shown as mean ± SEM; * P<0.05, **P<0.01. See also TableS1 and Figure S1.

