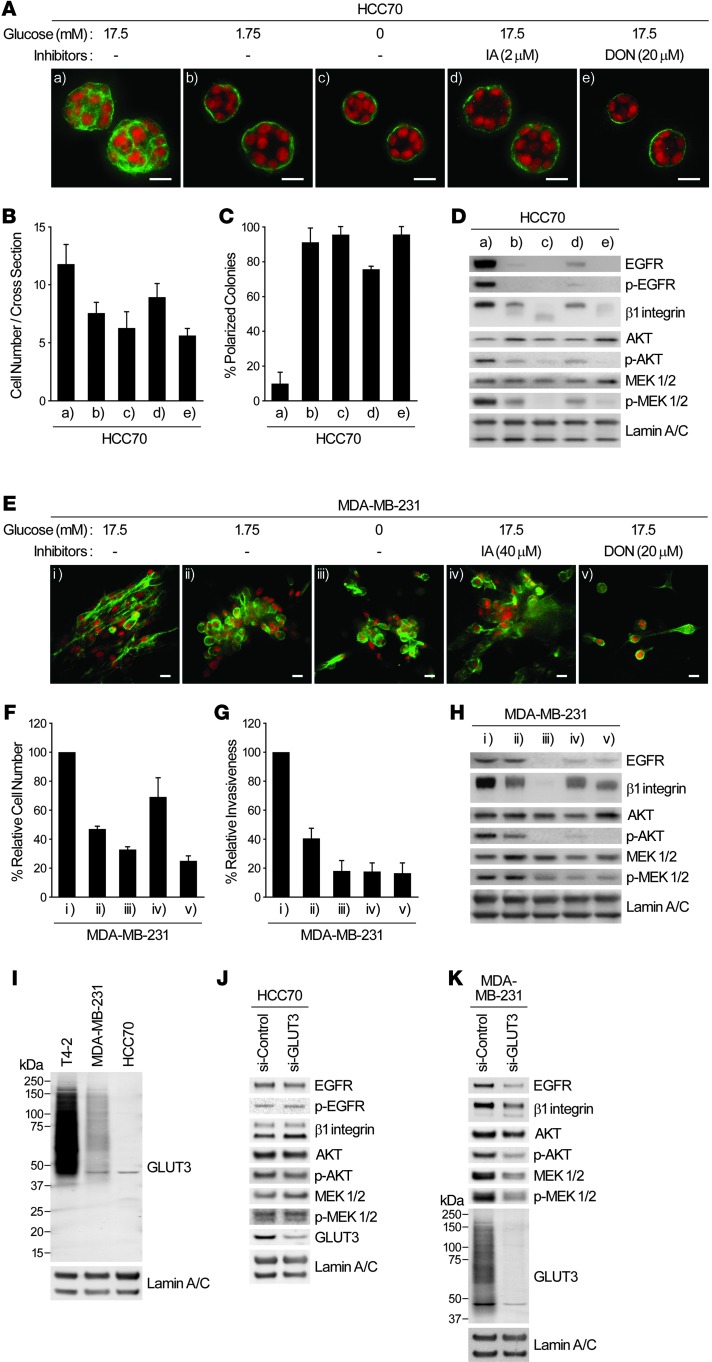
Figure 10. Other breast cancer cell lines also exhibit suppression of malignant phenotype when glucose uptake and metabolism are inhibited.
(A–D) HCC70 cells were cultured in 3D lrECM with 0, 1.75, or 17.5 mM glucose in the presence or absence of 2 μM IA or 20 μM DON. (A) Confocal IF images. Green, α6 integrin; red, nuclei. Scale bars: 20 μm. (B) Cell number at the colony midsection. (C) Percent colonies with basal polarity. (D) Western blot of signaling intermediates. (E–H) MDA-MB-231 metastatic cells were cultured in 3D lrECM with 0, 1.75, or 17.5 mM glucose in the presence or absence of 40 μM IA or 20 μM DON. (E) Confocal IF images showing phalloidin staining. Green, β-actin; red, nuclei. Scale bars: 20 μm. (F) Total cell numbers, measured by DNA staining. (G) Invasive activity. (H) Western blot of signaling intermediates. (I) Protein expression of GLUT3 in the indicated breast cancer cell lines cultured in 3D lrECM. (J and K) Western blot of signaling intermediates in HCC70 (J) or MDA-MB-231 (K) cells transfected with control or GLUT3 siRNA. In B, C, F, and G, data are mean ± SD of triplicate experiments.

