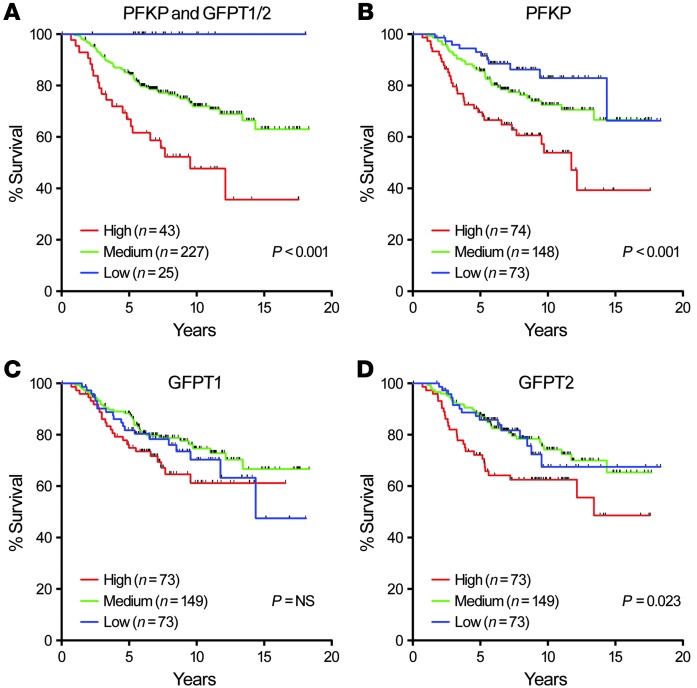
Figure 11. Analysis of previously published microarray dataset of samples from 295 breast cancer patients.
(A–D) Kaplan-Meier survival analysis of 295 breast cancers (45) classified as having high, medium, or low expression of PFKP, GFPT1, GFPT2, either together (A) or singly (B–D). P values were calculated using log-rank test.

