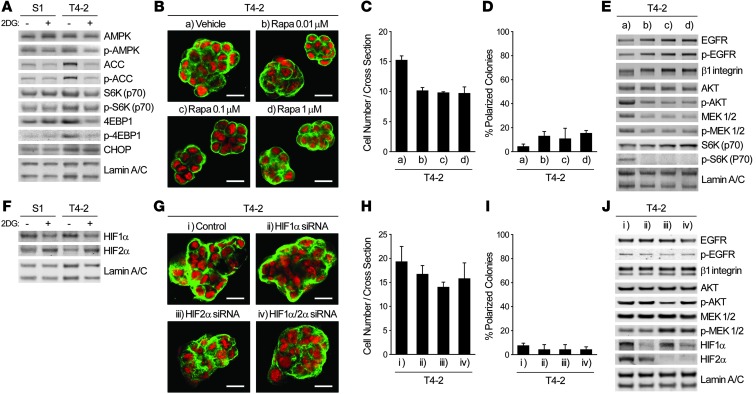
Figure 4. Integration of increased aerobic glycolysis and oncogenic signaling in 3D cultures does not involve the canonical metabolic signaling pathways.
(A) Western blot of proteins regulating — or influenced by — metabolism in S1 or T4-2 cells cultured in 3D lrECM with or without 4 mM 2DG. (B–E) T4-2 cells treated with vehicle or with 0.01, 0.1, or 1.0 μM rapamycin (Rapa) were cultured in 3D lrECM. (B) Confocal IF images. Green, α6 integrin; red, nuclei. Scale bars: 20 μm. (C) Cell number at the colony midsection. (D) Percent colonies with basal polarity. (E) Western blot of signaling intermediates. (F) Western blot of HIF-1α and HIF-2α in S1 or T4-2 cells cultured in 3D lrECM with or without 4 mM 2DG. (G–J) T4-2 cells transfected with control, HIF-1α, HIF-2α, or HIF-1α/2α siRNA were cultured in 3D lrECM. (G) Confocal IF images. Green, α6 integrin; red, nuclei. Scale bars: 20 μm. (H) Cell number at the colony midsection. (I) Percent colonies with basal polarity. (J) Western blot of signaling intermediates. In C, D, H, and I, data are mean ± SD of triplicate experiments.

