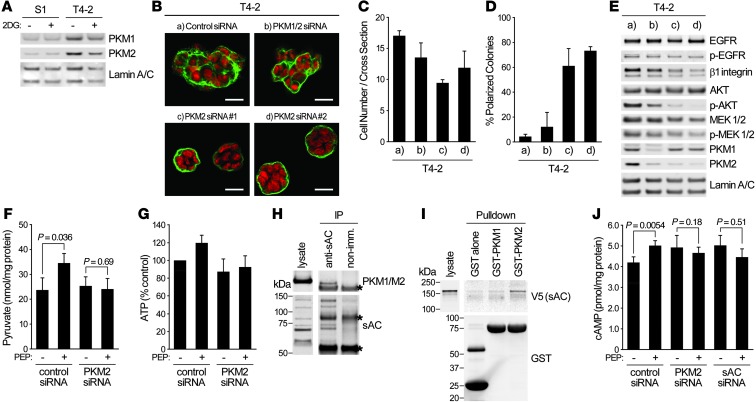
Figure 7. PKM2 associates with sAC to link glycolysis and cAMP signaling.
(A) Western blot of PKM1 and PKM2 in S1 or T4-2 cells cultured in 3D lrECM with or without 4 mM 2DG. (B–E) T4-2 cells transfected with control siRNA, PKM1/2 siRNA, or 2 PKM2 siRNAs were cultured in 3D-OT lrECM. (B) Confocal IF images. Green, α6 integrin; red, nuclei. Scale bars: 20 μm. (C) Cell number at the colony midsection. (D) Percent colonies with basal polarity. (E) Western blot of signaling intermediates. (F and G) T4-2 cells were cultured in 3D-OT lrECM with 1.75 mM glucose, and 0.5 mM PEP was added. Levels of pyruvate (F) and ATP (G) were measured. (H) Immunoprecipitation of sAC from lysate of T4-2 cells cultured in 3D-OT lrECM. Precipitates were blotted with the indicated antibodies. Asterisks denote nonspecific bands. (I) Pulldown assay using GST-tagged PKM1 or PKM2 bound to agarose beads and lysate from 293T cells expressing V5-tagged sAC. Precipitates were blotted with the indicated antibodies. GST alone was used as a control. (J) Level of cAMP in T4-2 cells transfected with the indicated siRNAs and cultured in 3D-OT lrECM with 1.75 mM glucose, before and after addition of 0.5 mM PEP. In C, D, F, G, and J, data are mean ± SD of triplicate experiments. P values were calculated using Student’s t test.

