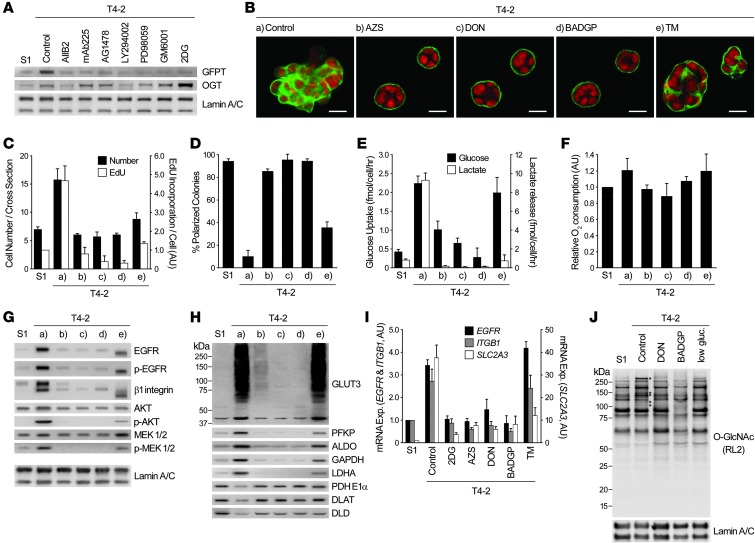
Figure 8. HBP supports oncogenic signaling and malignant phenotype through O-GlcNAcylation.
(A) Western blot of GFPT and OGT in S1 cells, T4-2 cells, and T4-2 cells reverted with 2DG or different signaling inhibitors (see Figure 1A). The same lamin A/C blots also served as a control for Figure 1, C and E. (B–H) T4-2 cells were cultured in 3D lrECM with or without inhibitors of GFPT (20 μM AZS or DON), O-GlcNAc transferase (5 mM BADGP), or N-glycosylation (10 ng/ml TM). (B) Confocal IF images. Green, α6 integrin; red, nuclei. Scale bars: 20 μm. (C) Cell number at the colony midsection (black bars) and EdU incorporation per cell (white bars). (D) Percent colonies with basal polarity. (E) Glucose uptake (black bars) and lactate release (white bars). (F) Relative oxygen consumption rate. (G and H) Western blot of signaling intermediates (G) and GLUT3 and metabolic enzymes (H). Lamin A/C served as a control for both G and H. (I) mRNA expression of EGFR, ITGB1, and SLC2A3 in S1 cells, T4-2 cells, and T4-2 cells reverted with metabolic inhibitors. Expression level of each gene was normalized to 18S ribosomal RNA. (J) Total O-GlcNAc level in S1 cells, T4-2 cells, and T4-2 cells reverted with DON, BADGP, or low glucose (low gluc; 0.175 mM). Asterisks denote O-GlcNAc bands specifically increased in T4-2 cells. In C–F and I, data are mean ± SD of triplicate experiments.

