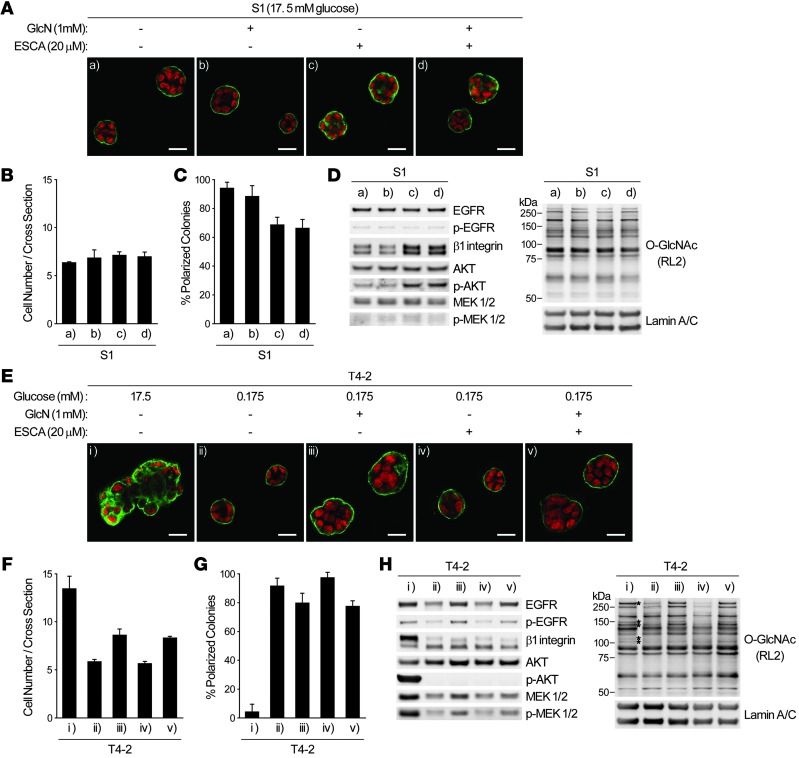
Figure 9. Activation of O-GlcNAcylation or EPAC-RAP1 pathways affects phenotypes of nonmalignant or reverted malignant mammary epithelial cells.
(A–D) S1 cells were cultured in 3D lrECM with or without 1 mM GlcN or 20 μM ESCA. (A) Confocal IF images. Green, α6 integrin; red, nuclei. Scale bars: 20 μm. (B) Cell number at the colony midsection. (C) Percent colonies with basal polarity. (D) Western blot of signaling intermediates and total O-GlcNAc. Lamin A/C served as a control. (E–H) T4-2 cells were cultured in 3D lrECM with 17.5 or 0.175 mM glucose, 1 mM GlcN, and/or 20 μM ESCA. (E) Confocal IF images. Green, α6 integrin; red, nuclei. Scale bars: 20 μm. (F) Cell number at the colony midsection. (G) Percent colonies with basal polarity. (H) Western blot of signaling intermediates and total O-GlcNAc. Lamin A/C served as a control. Asterisks denote O-GlcNAc bands specifically increased in T4-2 cells. In B, C, F, and G, data are mean ± SD of triplicate experiments.

