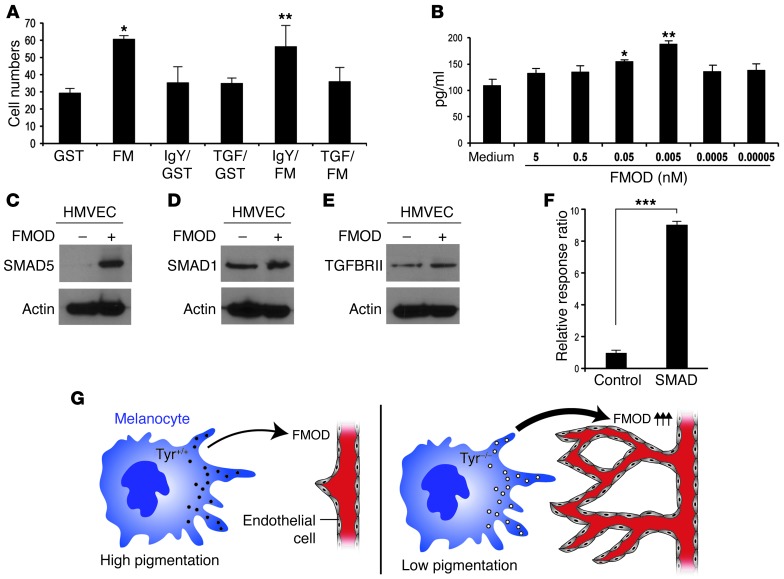
Figure 6. FMOD induces TGFB1 secretion by endothelial cells in vivo.
(A) HMVECs treated with neutralized anti-TGFB1 overnight and HMVEC migration were assessed in response to 3 nM recombinant FMOD or control. *P = 0.00018; **P = 0.002. (B) FMOD at designated concentrations and time courses induces TGFB1 secretion, measured in pg/ml by ELISA. P < 0.0001. Experiment repeated more than 3 times. *P = 0.003; **P = 0.0002. (C–E) HMVECs treated with 0.5 nM FMOD were assessed by Western blot using antibodies against SMAD5 (C), SMAD1 (D), and TGFRII (E). β-Actin was used as a loading control. (F) HMVECs were transfected with SMAD reporter and negative and positive control and treated with recombinant FMOD or control. Dual luciferase assay was performed and values are expressed using Renilla for internal normalization. Experiments were done in triplicate and repeated at least 3 times. ***P < 0.0001. (G) Diagram showing the role of melanocytes in angiogenesis. Lower-pigmented melanocytes express higher levels of FMOD, which stimulates angiogenesis. All experiments were repeated 3 times and included 10 eyes per group in each experiment.

