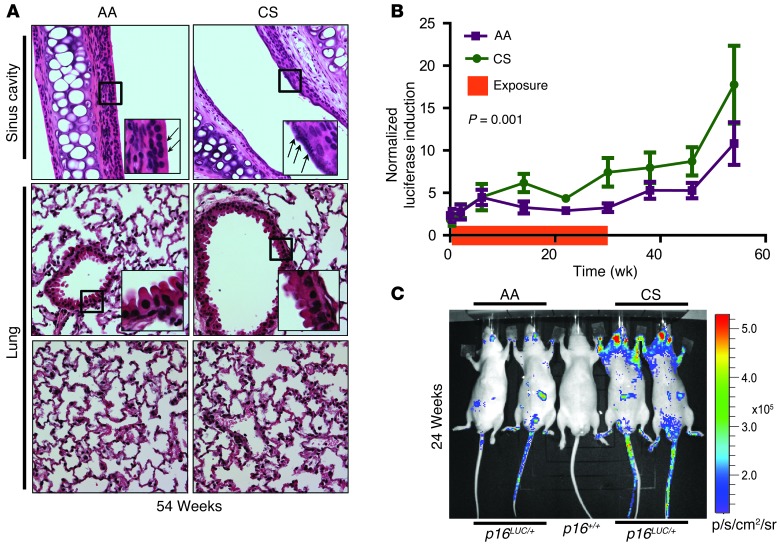
Figure 2. CS increases p16INK4a expression. p16LUC mice were exposed to CS or AA.
(A) Upper sinus cavity (top), airway bronchioles (middle; airway epithelium peg cells highlighted), and alveolar sacs (bottom) after 54 weeks. Arrows indicate areas of particulate deposit along the epithelial layer. Original magnification, ×40, ×280 (insets). (B) Luciferase intensity, normalized to mean luciferase levels of the entire cohort at day 0 and graphed as a function of time. Exposure duration is shown by the orange bar on the x axis. Error bars indicate SEM. P value was determined by linear regression analysis. (C) Representative TBLI of experiments in B.

