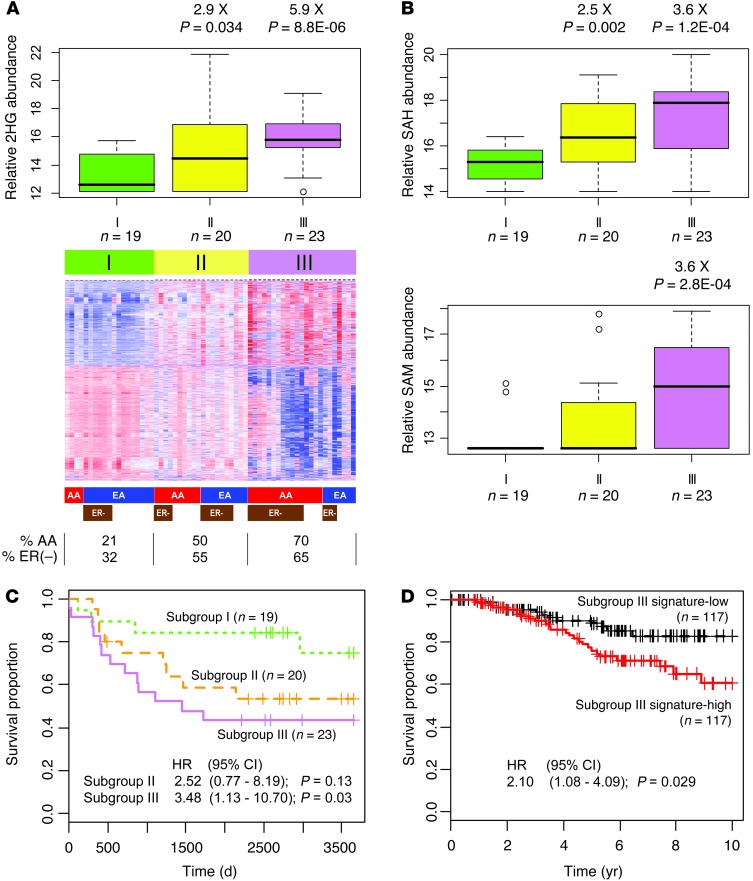
Figure 3. A poor outcome tumor subgroup defined by DNA methylation and metabolite profiles.
(A) Heat map representing 2,102 probes highlighting breast tumor subgroups I–III with distinct DNA methylation profiles. Colored bars below the heat map indicate sample classes: red, AA; blue, EA; brown, ER-negative. Percent AA and ER-negative cases in each subgroup is also shown. Box plots above show relative abundance of 2HG in each subgroup (box, interquartile range; line within box, median). Subgroup I is reference for fold difference. (B) Box plots representing relative abundance of SAH and SAM by subgroup. (C) Subgroup III tumors were associated with poor outcome. Kaplan-Meier curves with Cox regression analysis results are shown. HR, hazard ratio. (D) Association between subgroup III DNA methylation signature and breast cancer–specific survival in a publicly available dataset (22). The survival of patients with the subgroup III DNA methylation signature (Subgroup III signature-high) was significantly poorer than that of other patients. Kaplan-Meier curves with Cox regression analysis results are shown.

