
Figure 1. RB is inactivated in proliferating PCCs exhibiting phospho-Smad2 in human PDAC.
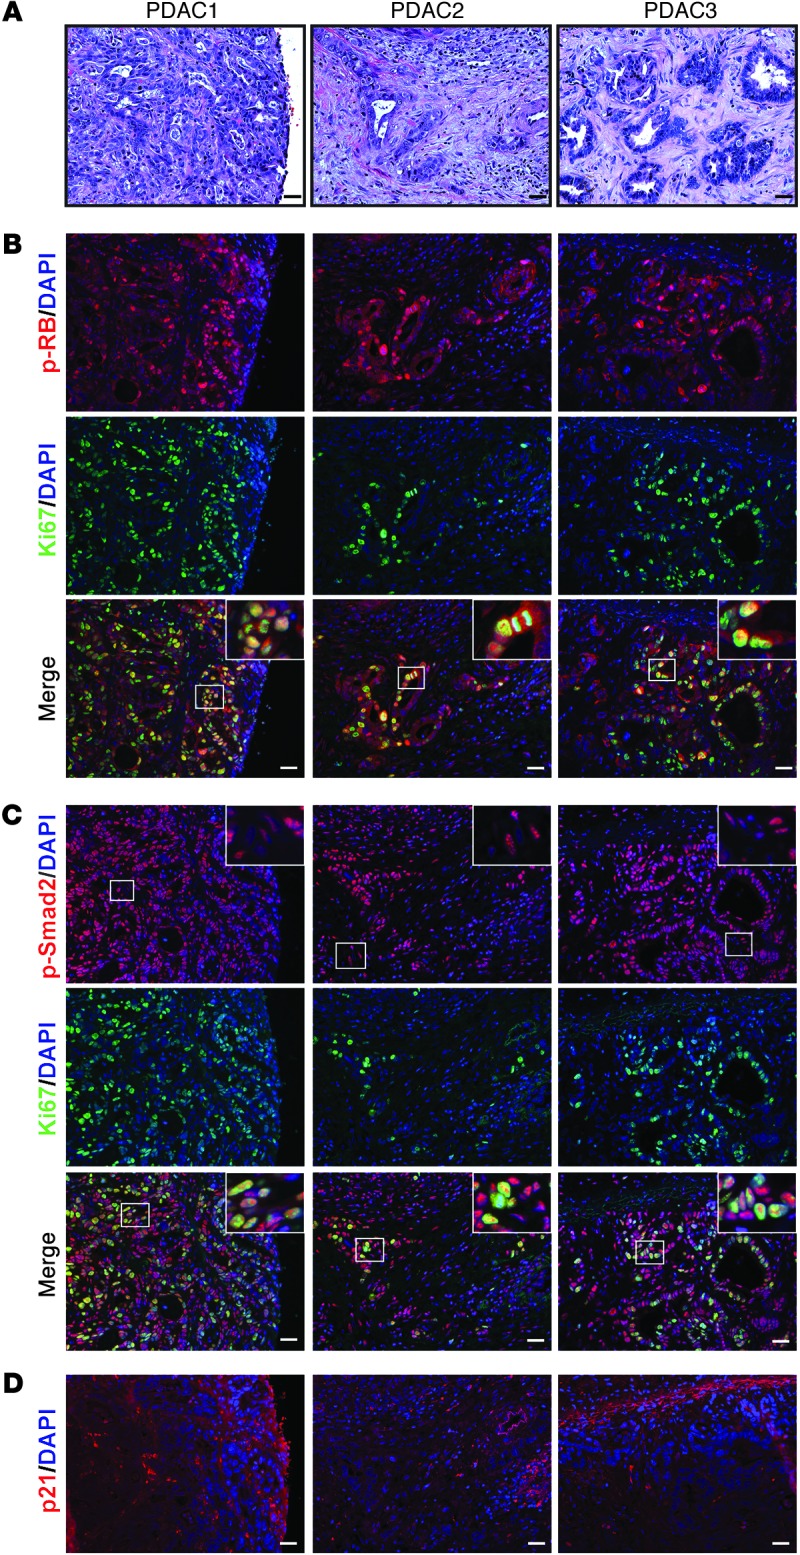
(A) H&E staining. Shown are representative images from 3 of 8 human PDAC tissues (PDAC1–3). (B) p-RB (red) was frequently detected in Ki67-positive cells (green) as evidenced by the overlay (merge). (C) p-Smad2 (red) was abundant in PCCs and adjacent stromal cells (insets show magnified images of boxed areas) and was frequently detected in Ki67-positive PCCs (green) as evidenced by the overlay (merge). (D) p21 (red) was mostly absent in PCC nuclei. Shown in B–D are serial sections of the PDACs in A. Scale bars: 50 μm.