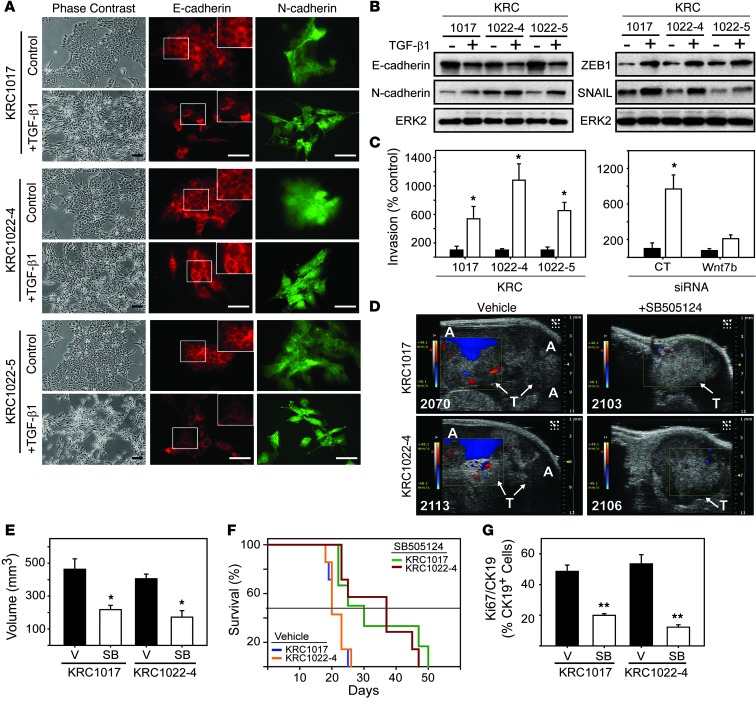
Figure 9. TGF-β1 induces EMT and invasion in KRC cells, whereas TβRI inhibition attenuates tumor growth and prolongs survival.
(A) TGF-β1 (0.5 nM) altered the epithelial morphology of KRC cells (phase contrast). Immunofluorescence for E-cadherin (red) and N-cadherin (green) shows that TGF-β1 altered the localization of E-cadherin (insets) and changed cell morphology. Scale bars: 50 μm. (B) TGF-β1 decreased E-cadherin and upregulated N-cadherin, ZEB1, and SNAIL. Shown are representative blots from three independent experiments. ERK2 was used to confirm equivalent lane loading. (C) TGF-β1 (white bars) enhanced invasion (left panel), and using KRC1022-4 cells, Wnt7b siRNA blocked this effect. *P < 0.032. Data represent the means ± SEM from three independent experiments. (D) High-resolution ultrasound images show that vehicle-treated mice harbored large tumors (T, arrows) and had formed ascites (A), as evidenced by color doppler (blue), whereas SB505124-treated tumors were smaller and ascites were not detectable. Shown are representative images from day 17. (E) Quantitation shows that SB505124 (SB, white bars) significantly attenuated tumor volumes. *P < 0.031. (F) Kaplan-Meier survival curves reveal that SB-505124 significantly prolonged the survival of mice bearing KRC1017- (green versus blue line, P = 0.026) and KRC1022-4–derived (red versus orange line, P = 0.007) tumors. Horizontal line indicates 50% survival. (G) Compared with vehicle (V, black bars), SB505124 (SB, white bars) significantly reduced the percentage of CK19-positive PCCs with Ki67. **P < 0.001. (E and G) Data represent the means ± SEM.

