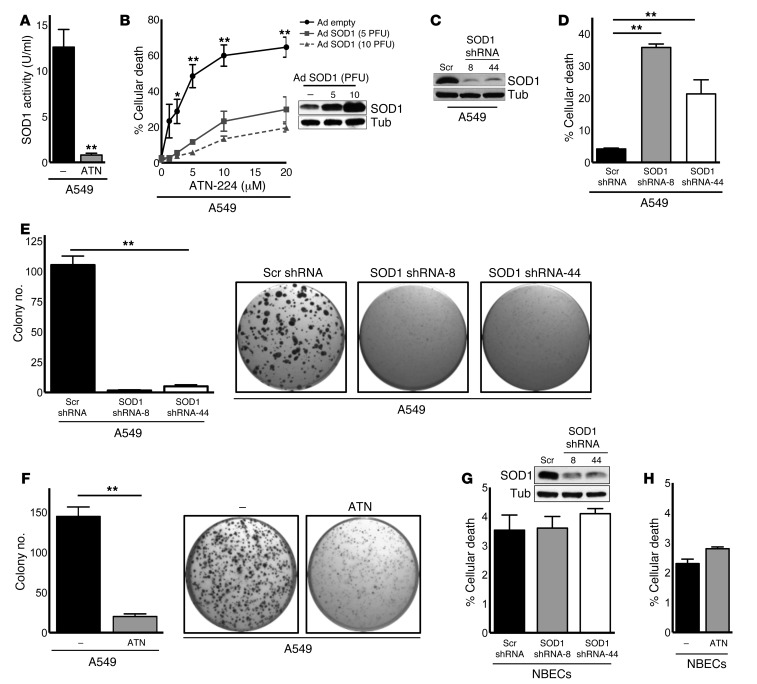
Figure 1. SOD1 inhibition causes cell death and anchorage-independent growth impairment in human NSCLC cells.
(A) SOD1 activity assay of A549 KRASonc human NSCLC cells treated for 24 hours with 10 μM ATN-224 (n = 3). (B) A549 cells expressing an empty adenoviral control vector or adenoviral SOD1 (Ad SOD1) were treated with increasing doses of ATN-224 (1.25, 2.5, 5, 10, and 20 μM), and cell death (96 hours) was determined (n = 3). Immunoblot for SOD1 of empty or Ad SOD1–expressing cells. Tubulin (Tub) was used as a loading control. (C and D) A549 cells expressing a pLKO.1 lentiviral scrambled (Scr) control vector or two independent SOD1 shRNA vectors (clones 8 and 44) were (C) immunoblotted for SOD1 and (D) analyzed for cell death 96 hours after infection (n = 3). (E and F) Analysis of soft agar colonies of A549 cells (E) expressing pLKO.1 control or SOD1 shRNA vectors (clones 8 and 44) and (F) treated for 3 weeks with 10 μM ATN-224. Images show colony formation in 96-well plates (n = 8, n = 13). (G and H) NBECs (G) expressing pLKO.1 control or SOD1 shRNA vectors (clones 8 and 44) were immunoblotted for SOD1 or (H) treated with 10 μM ATN-224 and analyzed for cell death (96 hours) (n = 3). Data are represented as the mean ± SEM. *P < 0.05. **P < 0.01. See also Supplemental Figure 1.

