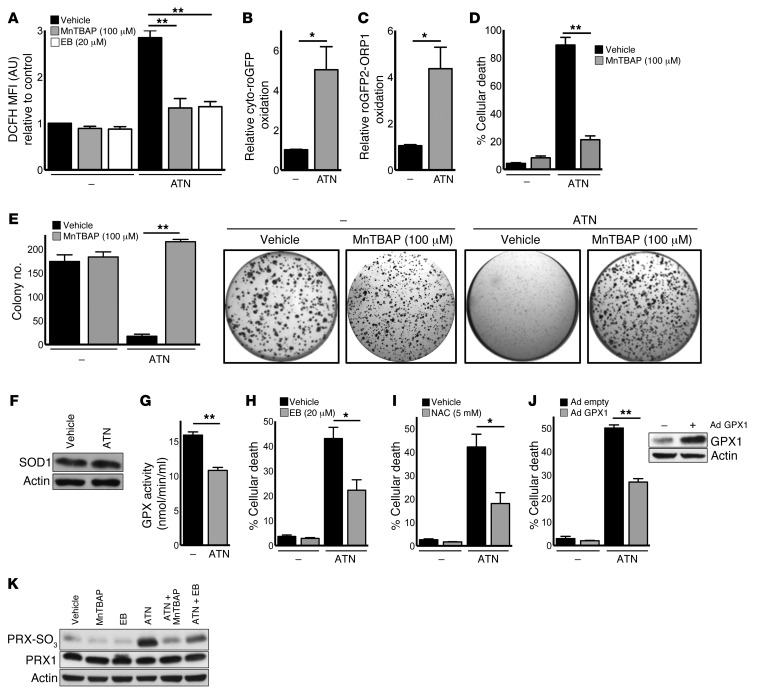
Figure 2. SOD1 inhibition induces cell death by diminishing antioxidant protein activities, leading to an increase in H2O2.
(A) A549 cells were treated with 10 μM ATN-224 alone or with 100 μM MnTBAP or 20 μM ebselen. ROS levels were determined by DCFH staining (10 μM, 24 hours) (n = 3). (B and C) A549 cells were treated with 10 μM ATN-224, and H2O2 levels were determined by (B) cyto-roGFP or (C) roGFP2-ORP1 oxidation (both 24 hours) (n = 3). (D and E) A549 cells were treated with 10 μM ATN-224 alone or with 100 μM MnTBAP, and (D) cell death (96 hours) and (E) anchorage-independent growth (3 weeks) were determined (n = 3, n = 7). (F) ATN-224–treated A549 cell lysates were taken (48 hours) and immunoblotted for SOD1. (G) A549 cells were treated with 10 μM ATN-224, and GPX activity was determined (48 hours) (n = 4). (H and I) A549 cells were treated with 10 μM ATN-224 alone or with (H) 20 μM ebselen or (I) 5 mM NAC, and cell death was determined (96 hours) (n = 4, n = 3). (J) A549 cells expressing empty adenoviral vector (Ad empty) or adenoviral GPX1 (Ad GPX1) were treated with 10 μM ATN-224, and cell death (96 hours) was determined (n = 7). Immunoblot for GPX1. (K) A549 cells were treated with 10 μM ATN-224 alone or with 100 μM MnTBAP or 20 μM ebselen. Cell lysates were immunoblotted for PRX-SO3. PRX1 was used as a loading control. Data are represented as the mean ± SEM. *P < 0.05. **P < 0.01. See also Supplemental Figure 2.

