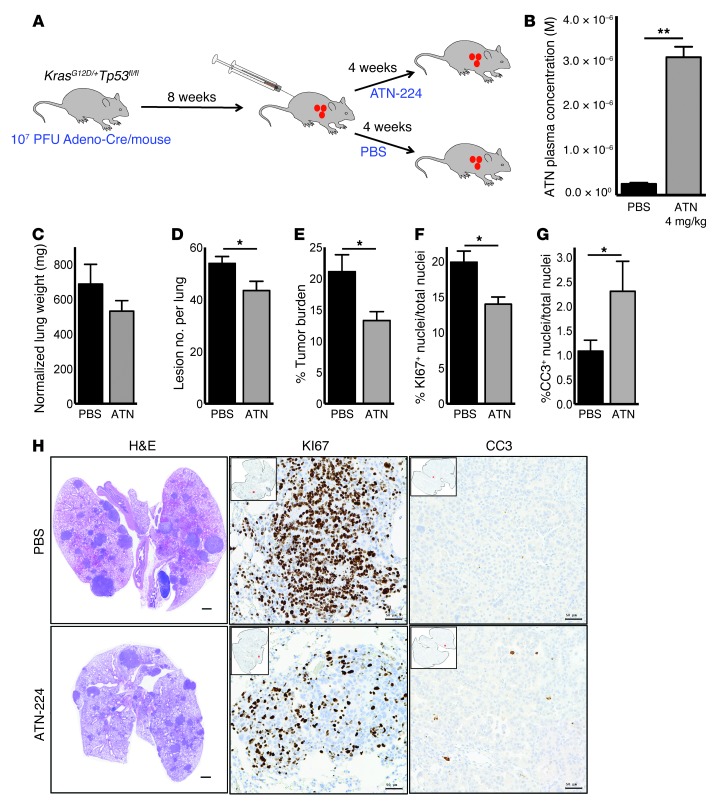
Figure 6. ATN-224 as a single agent reduces tumor burden in a preclinical KrasG12D Tp53fl/fl–driven mouse model of lung cancer.
(A) Schematic of experimental design. KP mice were intubated with 107 PFUs of adenoviral Cre and treated 8 wpi with PBS or 4 mg/kg ATN-224 every 2 days for 4 weeks. (B) KP mice were injected i.p. with PBS or 4 mg/kg ATN-224 for 4 weeks, and ATN-224 levels in blood plasma were determined (n = 3). (C–E) Lungs isolated from PBS and ATN-224–treated KP mice were analyzed for (C) lung weight normalized to body weight, (D) number of lesions per whole lung section, and (E) tumor burden per whole lung section (n = 16 PBS, n = 17 ATN-224). Tumor burden was calculated by averaging the tumor area from H&E-stained whole lung sections shown in H (left panel). (F and G) Lungs isolated from PBS and ATN-224–treated KP mice were analyzed for (F) KI67-positive cells per lung section and (G) CC3-positive cells per lung section (n = 5 PBS, n = 5 ATN-224). (H) Representative images of H&E- (left panels), KI67- (middle panels), and CC3-stained (right panels) KP lung sections from PBS and ATN-224–treated mice. H&E-stained images of whole lung sections represent tumor burden. Scale bars: 1 mm (left panels). KI67 (proliferation) and CC3 (cell death) images of tumors; positively stained cells appear in brown and nuclei in blue. Scale bars: 50 μM (middle and right panels). Data are represented as the mean ± SEM. *P < 0.05. **P < 0.01. See also Supplemental Figure 5.

