
Fig. 2.
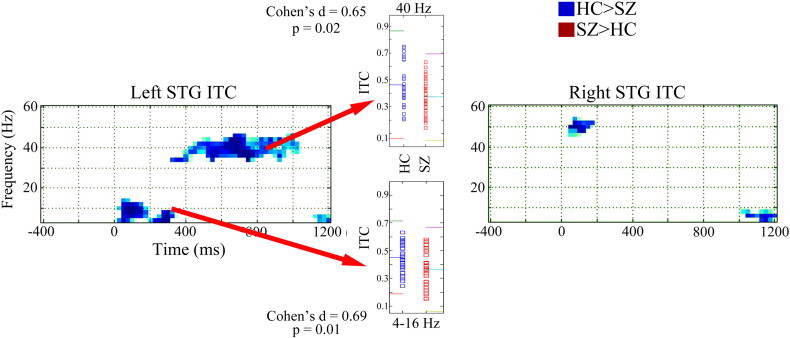
Inter-trial coherence family-wise corrected statistical maps for left and right STG (HC > SZ blue, SZ > HC red). Time is shown on the x axis and frequency on the y axis. Insets show left STG post-stimulus low-frequency (4 to 12 Hz activity averaged from 25 to 150 ms) and 40 Hz steady-state (38 to 42 Hz activity averaged from 300 to 950 ms) inter-trial coherence values for each subject. In the inset, for each measure, colored lines show the mean and ± 2 SD.