
Fig. 3.
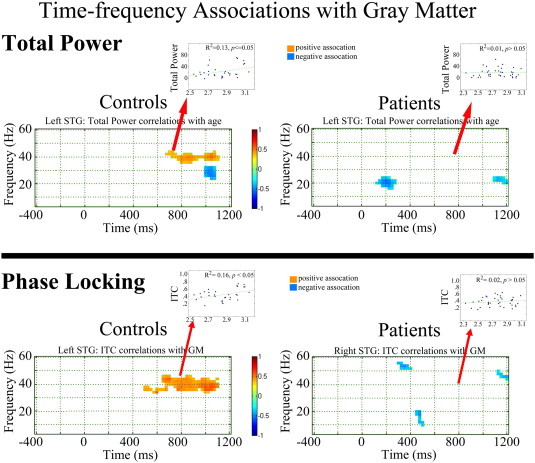
Family-wise corrected statistical maps showing correlations between gray-matter cortical thickness and left STG total power (upper panel) and ITC (lower panel) for each group. Time is shown on the x axis and frequency on the y axis. Insets show scatterplots of gray-matter cortical thickness versus left STG low-frequency (4 to 16 Hz activity averaged from 25 to 150 ms) and 40 Hz ITC and total power (38 to 42 Hz activity averaged from 300 to 950 ms) for each group, with the R2 values showing the percent variance explained.