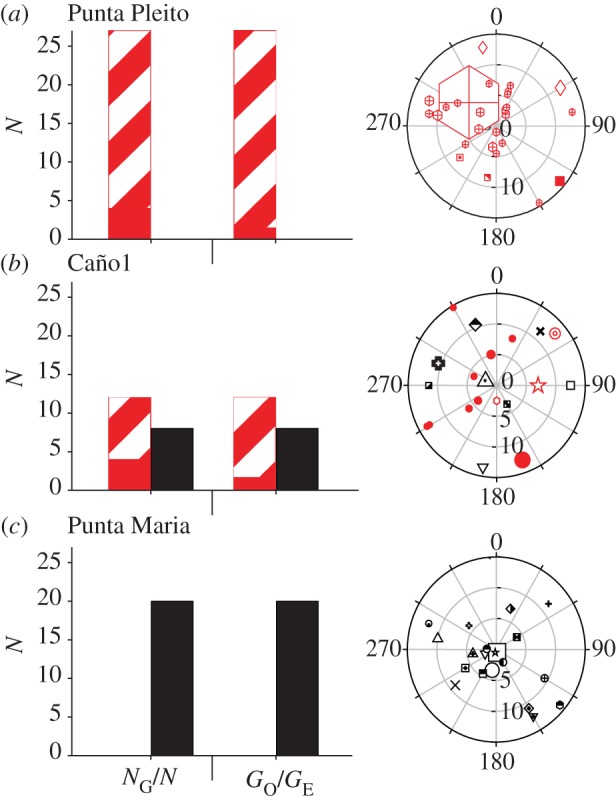
Figure 4.

Analysis of clonal structure in Costa Rica revealed greater clonal diversity in P. lobata (black) than P. evermanni (grey; red online). Panels show average genotypic diversity indices (NG/N and GO/GE) and representative polar plots (three out of 10) along the Costa Rican coast: Punta Pleito (a), Caño Island 1 (b), and Cocos Island: Punta Maria (c). In bar charts: striped bars, clones; solid bars, unique multi-locus genotypes (MLGs). In polar plots: unique MLGs are represented by unique symbols. Ramets of the same genet share symbols. Radial axis shows distance in 5 m increments and the angular axis is given in 30° increments. Colony symbols were scaled by colony area (range: 35 cm2–20.4 m2). (Online version in colour.)
