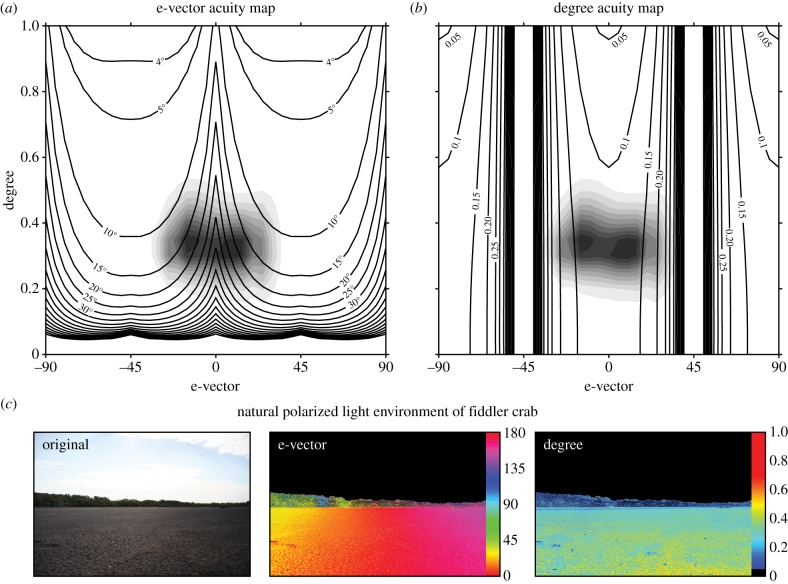
Figure 5.
Polarization acuity maps for the fiddler crab Uca vomeris. Black contour lines indicate the JND value for object e-vector (a) and degree (b) for all background linear polarization conditions. For (a) object degree is 1, and for (b) object e-vector axis is 90°. Note that the clustering of vertical contour lines in (b) indicates a steep decline in acuity towards the ±45° region. Shaded contours indicate the distribution of polarized light in the natural environment of the fiddler crab. These mudflat contours lie in the low e-vector acuity region in (a) and the high degree acuity region in (b). (c) Image polarimetry of a mudflat scene viewed in the direction of the sun (at around 45° above the horizon), from which the shaded contours in (a,b) are calculated. Note that in (c,d) all values less than 5% polarized have been assigned the colour black.

