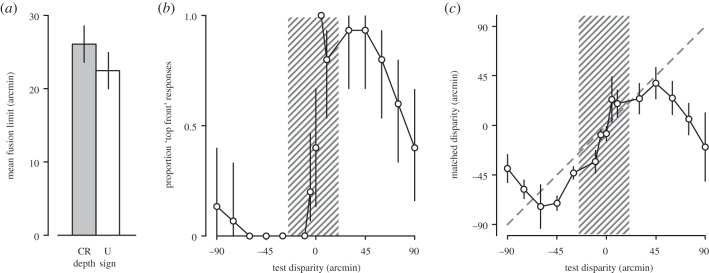
Figure 3.

Results from Experiment 1. (a) Mean fusion limits across observers for crossed (grey bar) and uncrossed (white bar) targets, as measured in the preliminary diplopia threshold measures. These limits are represented in (b,c) as the hatched areas. (b) Depth sign judgements from afterimages (Experiment 1). The proportion of ‘top in front’ (uncrossed disparity of the bottom bar) responses is plotted as a function of disparity. Negative disparities map onto crossed (near) stimuli and positive disparities map onto uncrossed (far) stimuli. (c) Depth magnitude estimates from afterimages expressed in terms of disparity. The matched disparity (calculated from the observers’ depth estimate, their interocular distance and the viewing distance) is plotted as a function of the test disparity. The diagonal dashed line shows unity (where the matched disparity equals the test disparity). All error bars show the bootstrapped 95% CIs of the mean.
