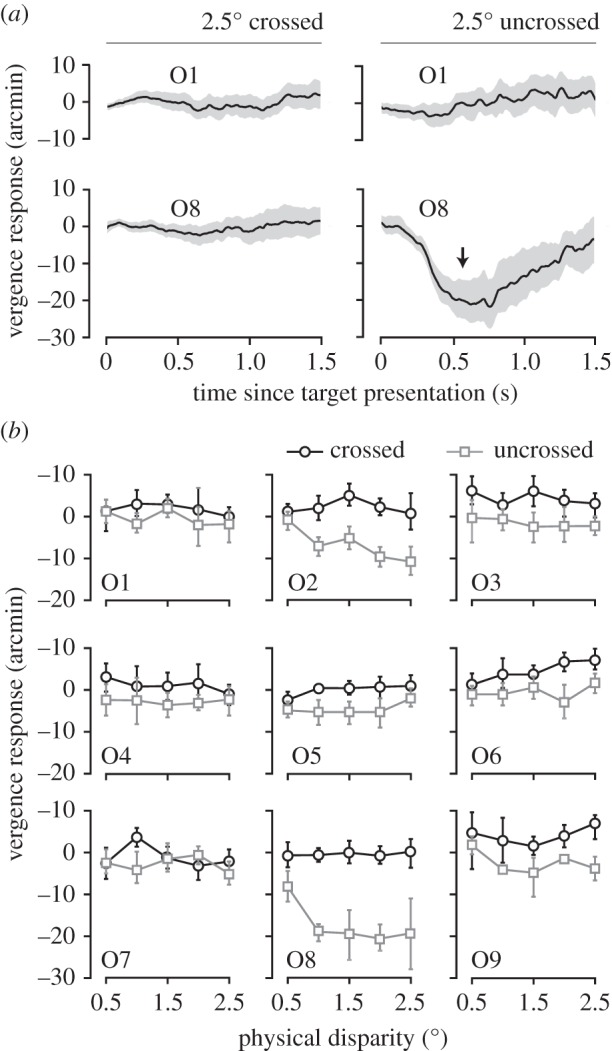
Figure 4.

Vergence responses from Experiment 2A. (a) Mean vergence responses as a function of time (since the target was presented) for two observers (O1 and O8 in (b)). Plotted are the two largest disparities we measured: 2.5° crossed (left) and uncrossed (right). The arrow marks 550 ms, the point that we defined as the maximum vergence response (plotted in (b) for all observers and disparities). The shaded areas show the 95% CI of the mean. (b) Mean vergence responses plotted as a function of the physical disparity for nine observers. Black circles show data for crossed disparities; grey squares show data for uncrossed disparities. Negative vergence responses are consistent with the eyes converging to a farther distance and vice versa (left eye's angular change in orientation minus the right eye's angular change in orientation; note that this is opposite to the convention used for disparity in this paper). Error bars show 95% CIs of the mean (some smaller error bars are contained within the symbol). Note that some grey squares overlap black circles.
