
Figure 1.
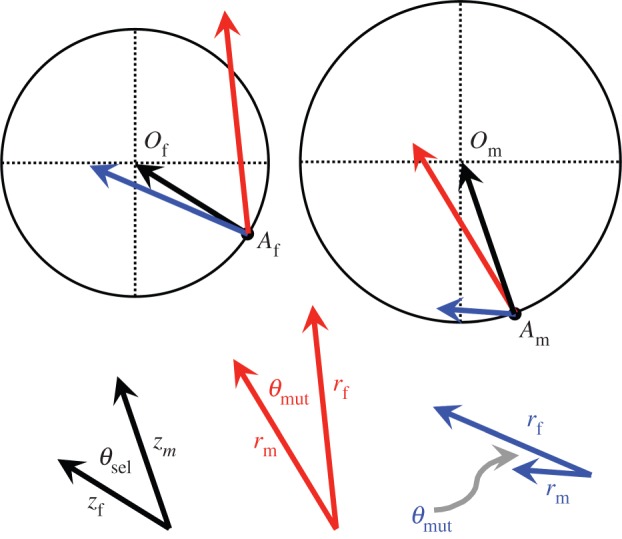
Fisher's geometric model in two dimensions and with two sexes. Trait values are represented by the x- and y-axes, with each of the traits expressed by both sexes. Af and Am depict the trait values expressed by females and males in the population, and Of and Om are the female and male trait optima. Black arrows represent the sex-specific selection vectors that reflect the distance of each sex to its optimum (vector lengths, zf and zm). Sex differences in directional selection are described by the angle between selection vectors (θsel). The fitness effects of each mutation depend on its phenotypic effect in each sex: its size (vector length, rm and rf) and orientation in phenotypic space. Sex differences in a mutation's orientation are described by the angle between mutation vectors (θmut). Mutations that bring a given sex closer to its optimum (i.e. within the relevant circle) are beneficial to that sex, whereas those causing movement away from the optimum will be deleterious (i.e. outside the relevant circle). Two mutations are shown: one that is beneficial to both sexes (blue), and the other that is sexually antagonistic (red).