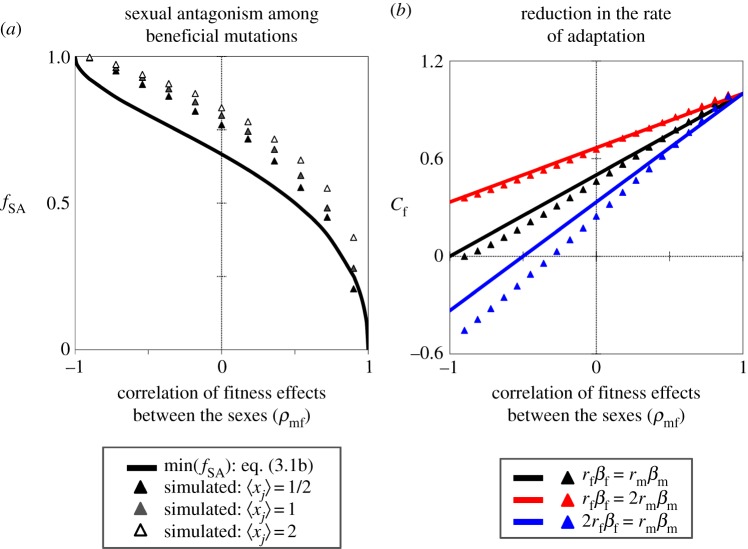
Figure 2.
The fitness effect correlation between sexes (ρmf) predicts the fraction of sexually antagonistic mutations, and the severity of constraints to sex-specific adaptation. The minimum fraction of beneficial mutations that are sexually antagonistic (fSA; (a)) is based on the approximation in equation (3.1b) (solid curve), and from exact simulation results, using three different mutation size distributions (triangles). Shown are results using a bivariate exponential distribution for rm and rf, with corr(rm, rf) = 0.9 and equal marginal distributions for rm and rf [35]. The mean scaled mutation size is 〈xj〉 = 〈rj〉√(n)/(2zj), with n = 25 dimensions, and zj = 1/2; j = {m, f}. Each simulation result is based on 10 000 randomly generated beneficial mutations (e.g. beneficial to at least one sex). The relative reduction in the rate of adaptation in females (Cf; (b)) is based on the small mutation approximation in equation (3.2) (solid lines). Exact simulation results are depicted by triangles, based on the parameters: rm = rf = 0.05, zm = zf = 1/2, n = 25 (xj = 0.25) and βm/βf = ωm/ωf. Additional details of the simulation procedure can be found in the electronic supplementary material.

