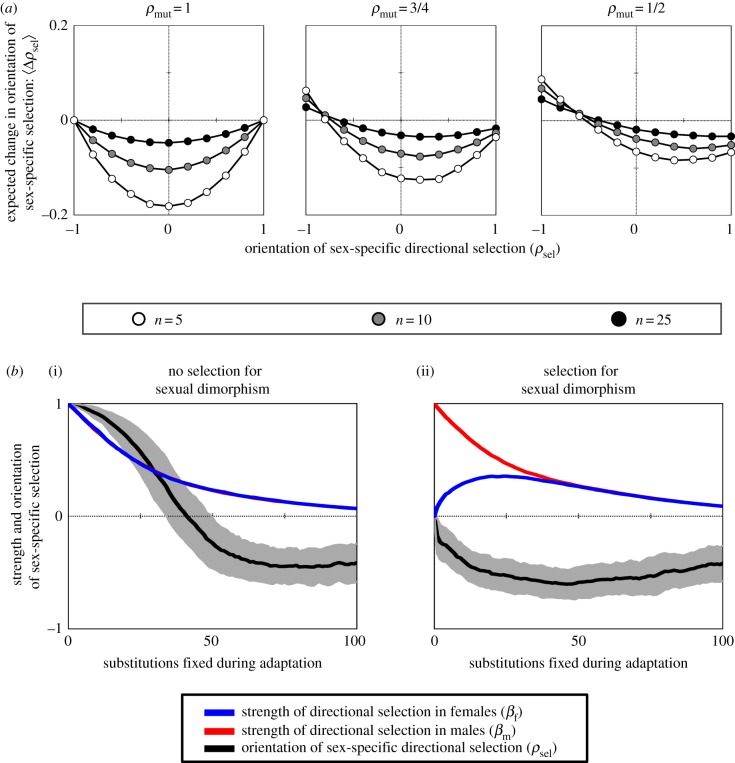
Figure 3.
Adaptation generates opposing directional selection between the sexes. (a) The average change in the orientation of directional selection in males and females during adaptation: 〈Δρsel〉. Each data point represents the average change for 10 000 simulated substitutions, with simulation parameters zm = zf = 1/2, ωm = ωf = 1, and mutation sizes drawn from a bivariate exponential distribution with marginal mean of 〈rm〉 = 〈rf〉 = 0.1 and between-sex correlation of corr(rm, rf) = 〈cos(θmut)〉 = ρmut. (b) The strength of directional selection in males and females (βm and βf) and the relative orientation of directional selection between the sexes (represented by ρsel), during adaptive walks. Each step of adaptation coincides with fixation of a positively selected mutation (with savg > 0), and the solid lines show averages over 100 simulated adaptive walks (shaded area shows ± one standard deviation for ρsel). Two extreme initial conditions of the population are shown: (b(i)) directional selection is initially identical in both sexes and phenotypic divergence between the sexes is not favoured (initial conditions: zm = zf = 1/2; θsel = 0; ρsel = 1); and (b(ii)) selection favours phenotypic divergence between males and females (males are initially displaced from their optimum but females are not; initial conditions: zm = 1/2; zf = 0). Mutation sizes were drawn from a bivariate exponential distribution with marginal means 〈rm〉 = 〈rf〉 = 0.05, and corr(rm, rf) = 〈cos(θmut)〉 = ρmut = 0.75. Additional parameters include ωm = ωf = 1. Additional results, and details of the simulation procedure, can be found in the electronic supplementary material.

