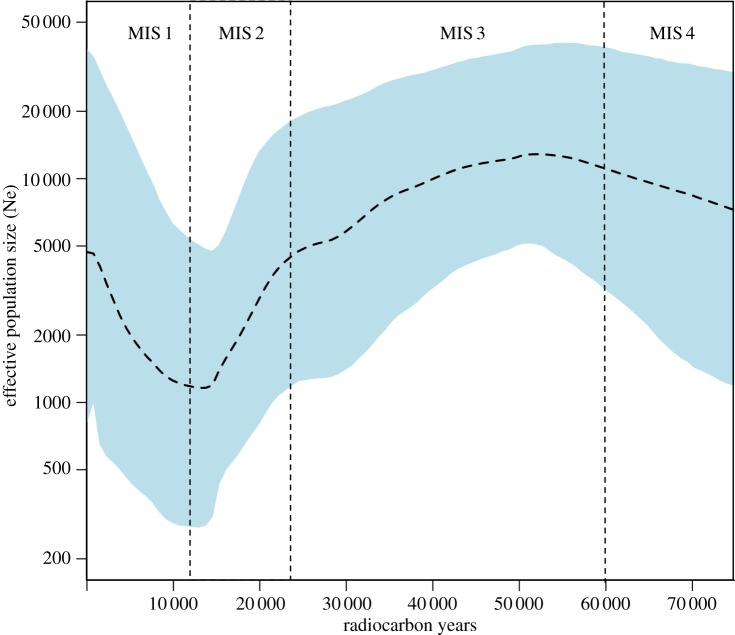
Figure 4.
Bayesian skyline plot derived from the analysis of modern and ancient wapiti sequences from northeast Siberia and North America. Only sequences with finite radiocarbon dates were included in the analysis, using a fixed clock and partitioned by gene region. The x-axis is in calibrated radiocarbon years BP, and the y-axis is the calculated effective population size using a generation time of 7 years. The dashed line represents median values, and the shaded area represents the 95% highest posterior density (HPD) limits.

