
Figure 1.
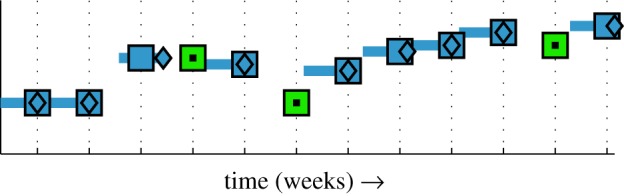
Illustration of resampling. Diamond markers represent the original, non-uniform time series and the horizontal lines to the left of each marker show the period over which the response is valid. Square markers represent the resampled series and those with a square central dot are imputed values. The x-axis or ‘comb’ shows the optimal weekday, which, when aligned with the original series, gives the minimum total distance (deviation) of the sample time from the response time. (Online version in colour.)