
Figure 2.
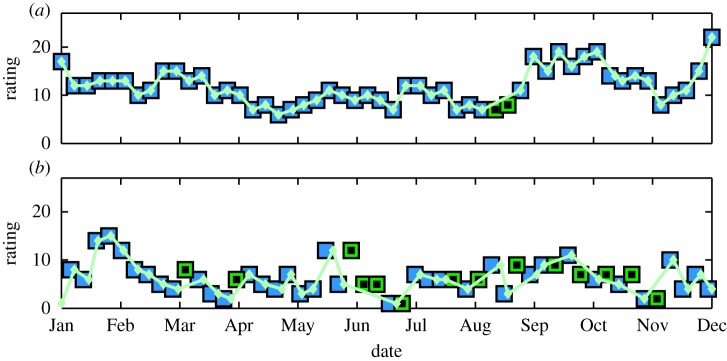
Effect of resampling on high- and low-compliance time series. The original responses are denoted by small diamond markers and the resampled series by the larger square border. Imputed values are shown with a central square dot. Plot (a) represents an approximately uniform original time series in which resampling preserves the time stamps of the original responses: most diamond markers are centred in the squares. Plot (b) illustrates a non-uniform series where many responses are late and some are missing. The late responses are shown by a diamond marker located to the right of centre of the square border. (Online version in colour.)