
Figure 3.
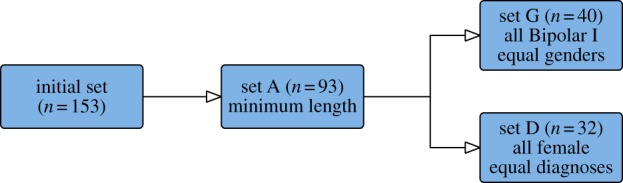
Flow chart for data selection. From the initial dataset, set A (n = 93) of time series having a minimum length of 25 data points is selected. Two further subsets are then selected from set A. Set G (n = 40) has equal numbers of each gender, all with a diagnosis of Bipolar I disorder. Set D (n = 32) has equal numbers of patients having Bipolar I and Bipolar II diagnoses, all of whom are female. The selection algorithm matches patients by time-series length. Where no patient of matching length can be found, the range is progressively widened until one or more matches is found. (Online version in colour.)