
Figure 7.
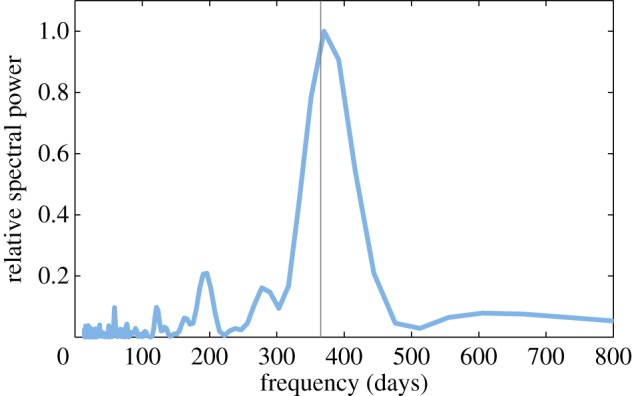
Lomb periodogram for a patient exhibiting seasonality of depression. The corresponding correlogram in figure 6 is third from the top. The spectral power is normalized by the peak power and the periodicity of 365 days is marked as a vertical line. The peak is at a period of 370 days and a second much smaller peak occurs at 196 days. In general, the depression time series do not show such clear evidence of yearly periodicity, although some patients have a peak at or near this period. (Online version in colour.)