
Figure 2.
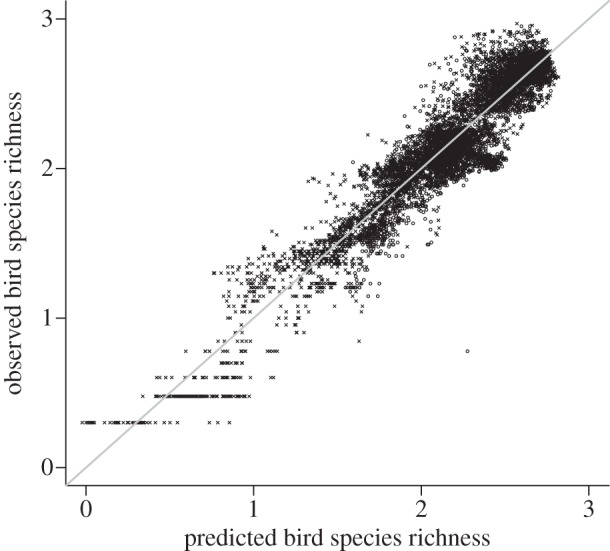
Observed log10-transformed bird species richness versus predicted richness from temperature and EVI. Richness for each 10 000 km2 quadrat is represented for the seasons of May to July (circles) and of December to February (cross symbols), and is calculated from range maps of 3902 birds in the Americas. The 1 : 1 line is shown in grey.