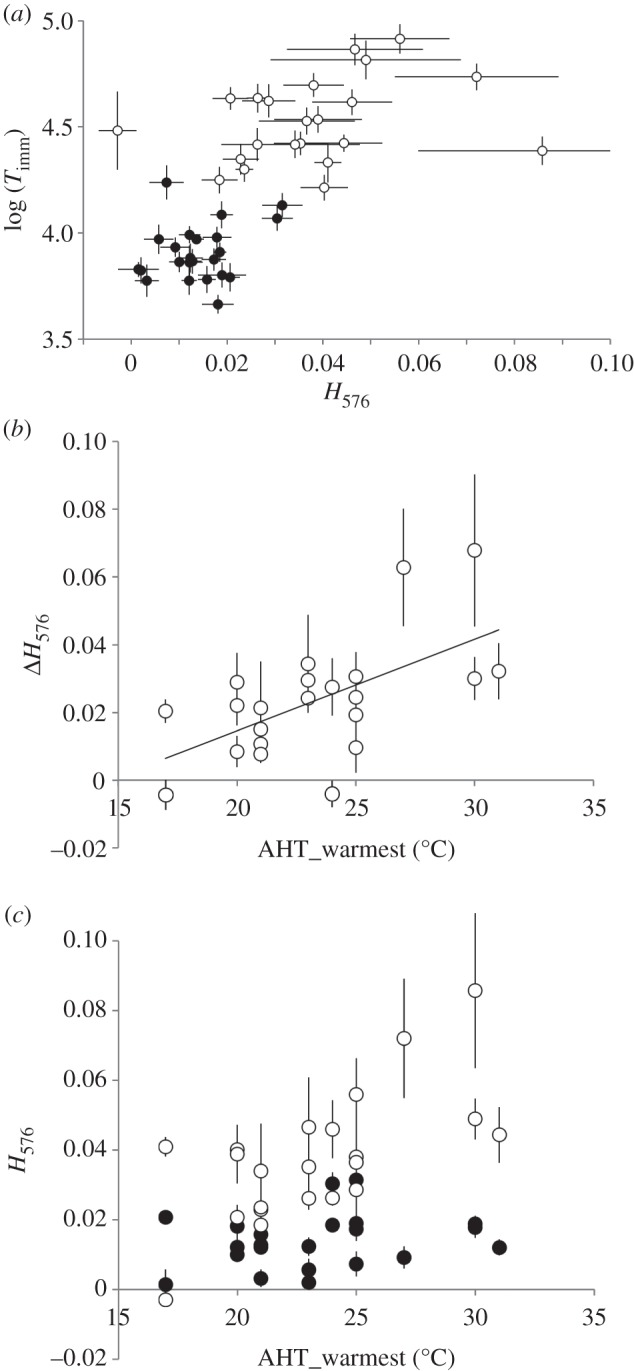
Figure 3.

(a) Time until immobilization (Timm; ±1 s.e.) in Daphnia acclimatized to either 20°C (filled circles) or 28°C (open circles) plotted against the relative haemoglobin absorbance peak height at 576 nm (H576; ±1 s.e.). (b) The difference between the relative haemoglobin absorbance peak height at 576 nm in 28°C and in 20°C (ΔH576 = H57628–H57620) as a function of average high temperature of the warmest month at the clones’ site of origin. Bars are standard errors. Coefficient of correlation = 0.60, p < 0.0011. (Bonferroni factor of 3 applied to account for the choice of climatic proxy out of three correlated aggregates.) (c) Same data as on (b) plotted for each acclimatization temperature separately. Linear regression coefficients for 20°C and 28°C are 0.00049 (s.e. = 0.00045, p > 0.1) and 0.00319 (s.e. = 0.00081, p < 0008); heterogeneity of slopes p < 0.006.
