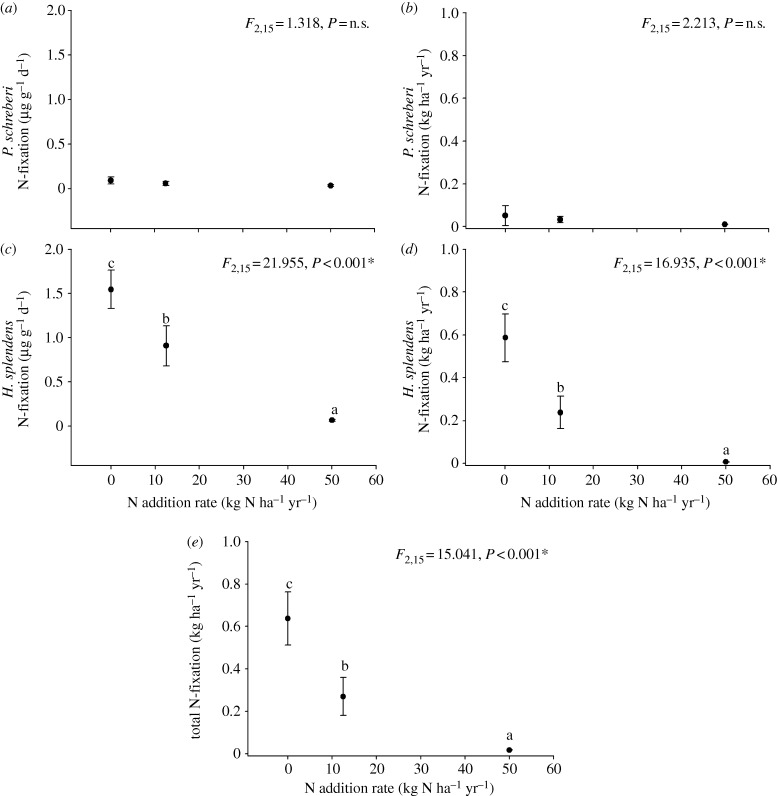
Figure 1.
The mean (±s.e.) N2-fixation rate (a,b) per unit mass, (c,d) per unit area of P. schreberi and H. splendens and (e) total N2-fixation rate per unit area in response to 16 years of experimental N addition treatments (0, 12.5 and 50 kg N ha−1 yr−1). Data were compared using ANOVA, and post hoc differences are indicated by different letters within each subpanel (a, b or c). An asterisk next to the p-value indicates that data were transformed (log (x + 1)) prior to analysis.

