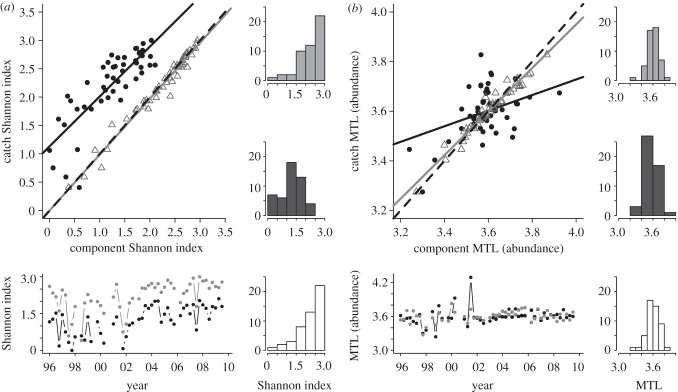
Figure 1.
Shannon (a) index and MTL in abundance (b) calculated quarterly for catch (y-axis) against those of its two components (x-axis); upper plots. The black and grey lines correspond to the linear regression of catch (y-axis) against landings (dots) and discards (triangles) (x-axis), while the dotted line is the null model of intercept 0 and slope 1; all p-values < 0.05. The lower plots correspond to the quarterly time series of the metrics estimated for landings (black) and catch (grey). The time series of discards was omitted for clarity as it overlaps with catch. Adjacent, to the right, are histograms of the frequency of each correspondent metric for catch (grey), landings (black) and discards (white).

