
Figure 1.
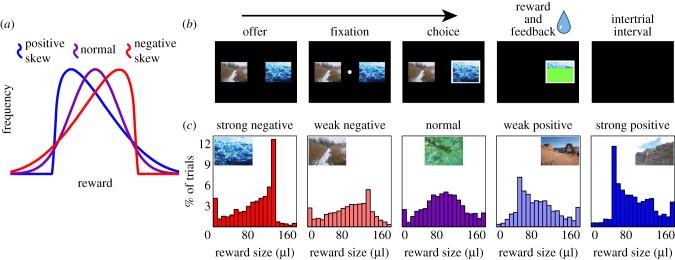
Skewness illustration and task design. (a) Illustrations of reward outcome distributions for positively skewed (blue), negatively skewed (red) and normal distributions (purple). (b) Randomly chosen nature photographs associated with each of a random pair of gambles were displayed for 500 ms. Then, a fixation dot would appear, requiring a 100 ms fixation to progress to the choice phase. Monkeys chose their preferred gamble by fixating on it for 200 ms, after which the gamble was resolved. Trials were separated by 1 s. (c) Histograms showing actual reward outcome distributions and photographs associated with the five gambles.