
Figure 4.
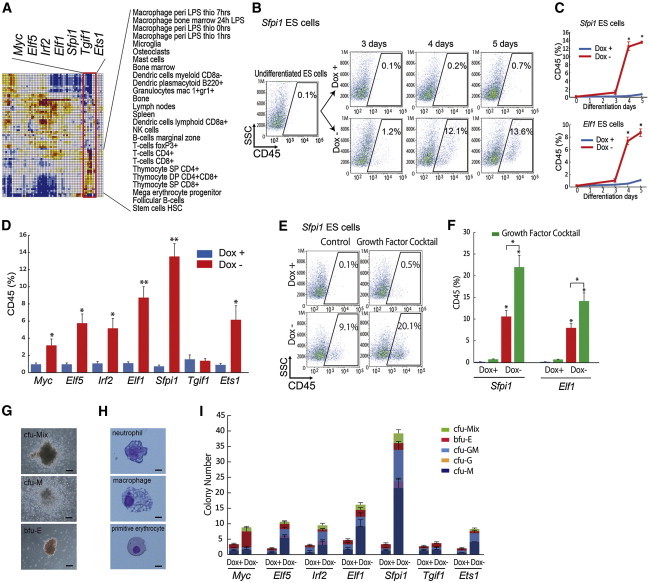
A Single TF Induces Blood Cells from ESCs
(A) Myc, Elf5, Irf2, Elf1, Sfpi1, Tgif1, and Ets1 are identified for ESC differentiation toward blood cells.
(B and C) FACS analysis for CD45 (pan-hematopoietic marker)+ cell appearance used ESCs carrying Sfpi1 or Elf1 gene (three independent experiments, SEM; ∗p < 0.01 versus Dox+).
(D) Quantitative evaluation of CD45+ cell percentages on day 5 of differentiation used ESCs carrying Myc, Elf5, Irf2, Elf1, Sfpi1, Tgif1, or Ets1 gene by FACS analysis (three independent experiments, SEM; ∗p < 0.05 and ∗∗p < 0.01 versus Dox+).
(E and F) FACS analysis for CD45+ cell appearance used ESCs carrying Sfpi1 or Elf1 gene with growth factor cocktail (three independent experiments, SEM; ∗p < 0.01 versus Dox+).
(G) Representative photomicrographs of mix lineage (top panel), macrophage (middle panel), and erythrocyte (bottom panel) at differentiation 11 days after colony-forming assay using ESCs carrying Sfpi1 gene are presented. Scale bars, 200 μm. cfu-Mix, colony forming unit (cfu)-mix lineage (erythrocyte/granulocyte/macrophage); cfu-M, cfu-macrophage; bfu-E, burst forming unit (bfu)-erythrocyte.
(H) May-Giemsa staining used ESCs carrying Sfpi1 gene. Scale bars, 10 μm.
(I) HPC colony numbers in the Dox+ (1 μg/ml) or Dox− condition after 11 days of colony-forming assay are shown (three independent experiments, the total number of colonies, Myc Dox+ was 3.34 ± 1.2 versus Dox− of 8.83 ± 0.88; Elf5 Dox+ was 2.03 ± 0.58 versus Dox− of 10.64 ± 1.53; Irf2 Dox+ was 3.02 ± 0.77 versus Dox− of 9.48 ± 2.31; Elf1 Dox+ was 4.67 ± 1.33 versus Dox− of 16.15 ± 2.52; Sfpi1 Dox+ was 3.34 ± 1.2 versus Dox− of 39.21 ± 3.18; Tgif1 Dox+ was 2.69 ± 0.66 versus Dox− of 3.68 ± 1.51; and Ets1 Dox+ was 2.03 ± 0.58 versus Dox− of 8.28 ± 2.01). cfu-Mix, colony-forming unit (cfu)-mix lineage (erythrocyte/granulocyte/macrophage); bfu-E, burst-forming unit (bfu)-erythrocyte; cfu-GM, cfu-granulocyte/macrophage; cfu-G, cfu granulocyte; cfu-M, cfu macrophage.
See also Figure S1.