
Figure 6.
Characterization of TF-Induced Differentiated Cells by Global Gene Expression Profiling and ChIP
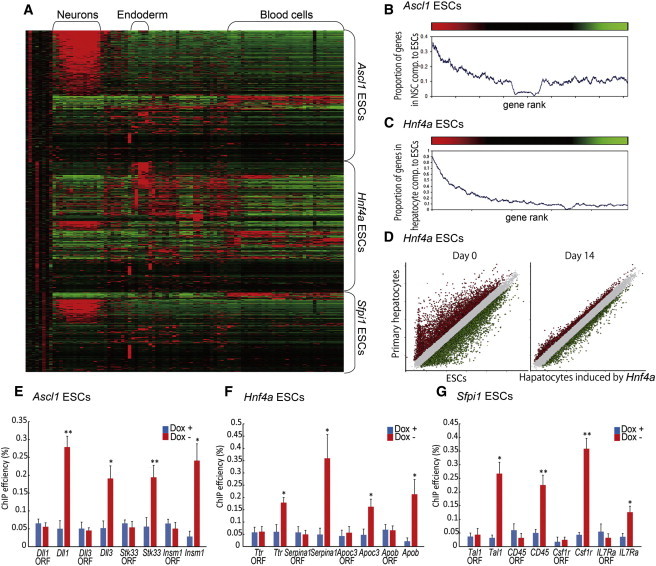
(A) A heatmap shows the association of genes upregulated >2-fold after the induction of TFs—Ascl1, Hnf4a, and Sfpi1 (upper, middle, and lower portions of the heatmap, respectively)—with transcriptomes of various tissues/organs in the GNF database. Red and green colors represent higher and lower gene expression levels, respectively. The first six columns show the changes of gene expression (log ratio between cells cultured in the Dox− and Dox+ conditions) after the induction of the TFs at day 3 (columns 1, 3, and 5) and day 7 (columns 2, 4, and 6). Other columns show the gene expression levels from the GNF database normalized to the median expression in all tissues/organs shown here. Hierarchical clustering was used to order both genes and tissue/organs from the GNF database and then the order was further edited manually.
(B) Rank plot analysis compared the gene expression profile of neurons induced by Ascl1 with that of NSCs derived from adult brains. Genes were sorted by expression changes after the induction of Ascl1 on day 7 (from high expression, red, to low expression, green). Then, the proportion of genes that were upregulated >3-fold in the NSCs compared to ESCs was estimated in a sliding window of 500 genes. Statistical significance was z = 57.37 and p < 10−100 (PAGE test, Kim and Volsky 2005).
(C) Rank plot analysis compared the gene expression profile of hepatocytes induced by Hnf4a with that of the primary hepatocyte culture. Genes were sorted by expression changes after the induction of Hnf4a on day 14. Then the proportion of genes that were upregulated >2-fold in hepatocytes compared to ESCs was estimated in a sliding window of 500 genes. Statistical significance was z = 138.96 and p < 10−100 (PAGE test).
(D) Scatterplots compared gene expression profiles of primary hepatocytes with that of ESCs or hepatocytes induced by Hnf4a on day 14 of differentiation.
(E–G) ChIP assays on neuron-related genes (E), hepatocyte-related genes (F), and blood cell-related genes (G) of day 7 of differentiation using ESC lines carrying Ascl1 (E), Hnf4a (F), or Sfpi1 (G) gene are presented. ORF primers were used as negative control (three independent experiments, SEM; ∗p < 0.05 and ∗∗p < 0.01 versus Dox+).
See also Figures S5, S6, and Table S1.