Figure 3.
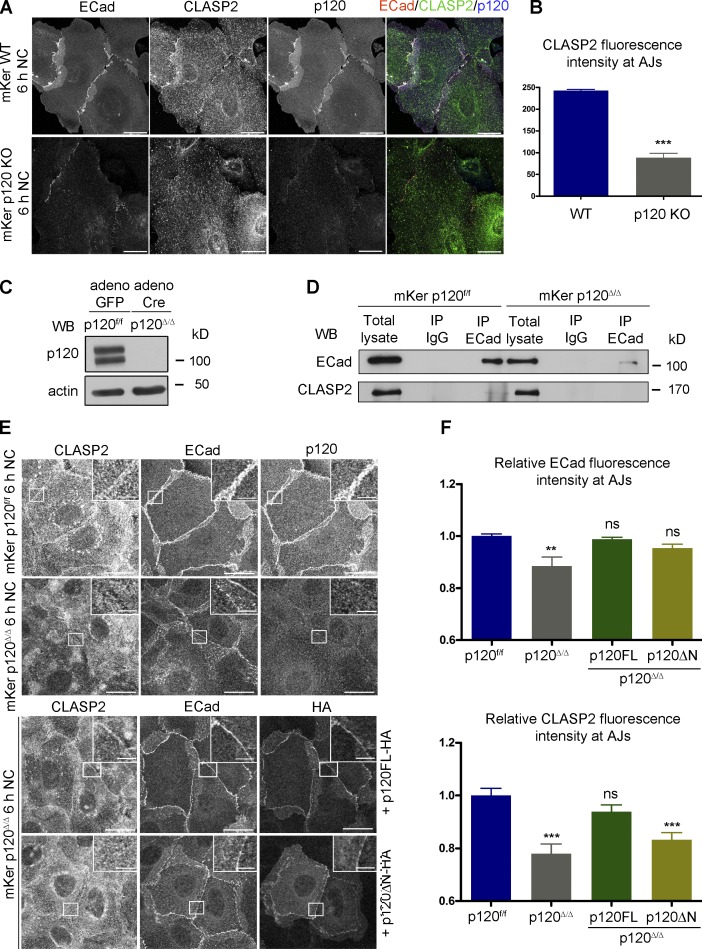
p120 is required for the recruitment of CLASP2 to AJs. (A) WT and p120 KO primary mKer immunostained for ECad, CLASP2, and p120 in the presence of calcium (NC). (B) Random individual plot profiles (n = 10 per cell/10 cells) were obtained from WT and p120 KO mKer. The fluorescence intensity level of CLASP2 corresponding to the maximum ECad intensity in each profile was quantified. Data are represented as means ± SEM; ***, P < 0.0001, Mann–Whitney U test. (C) Western blot (WB) showing the levels of p120 in primary mKer infected either with adeno-GFP (p120f/f) as a control or adeno-Cre-GFP (p120Δ/Δ). (D) ECad was immunoprecipitated from control p120f/f or from p120-null mKer (p120Δ/Δ). The immunoprecipitates (IP) were analyzed for ECad and CLASP2 by immunoblotting. (E) p120Δ/Δ mKer were transfected with either p120FL-HA or p120ΔN-HA and switched to a normal calcium media (NC) for 6 h. p120f/f and p120Δ/Δ mKer nontransfected were used as controls. Cells were immunostained for CLASP2, ECad, and HA. Insets are magnifications of the boxed regions. (F) Quantification of ECad and CLASP2 fluorescence intensity at AJs. Random individual plot profiles were generated at sites of cell–cell adhesion. The maximum value of ECad fluorescence intensity in the profile and its associated CLASP2 fluorescence intensity were quantified. Data were normalized to control values (p120f/f mKer) and represented as means ± SEM. **, P < 0.002, Mann–Whitney U test for ECad; ***, P < 0.0003, Student’s t test for CLASP2 (10 plot profiles per cell and 16 cells per condition). Bars: (A and E, main images) 25 µm; (E, insets) 5 µm.

