Figure 4.
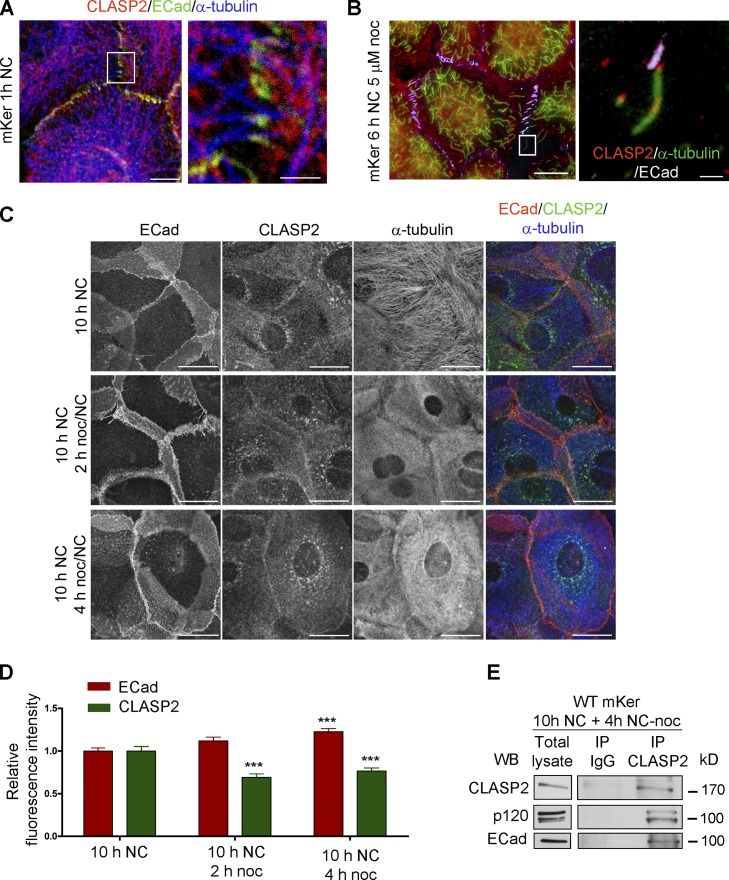
CLASP2 is present at AJs either associated to MTs or in an MT-independent manner. (A) WT mKer were treated with calcium for 1 h and immunostained for CLASP2, ECad, and α-tubulin. The right image is a higher magnification of the selected region. (B) WT mKer were treated with calcium for 4 h followed by treatment with 5 µM nocodazole (noc) for 30 min and extraction of monomeric tubulin with saponin. Cells were immunostained for ECad, CLASP2, and α-tubulin. The right image is a higher magnification of the selected region. (C) WT primary mKer were treated with calcium (NC) for 10 h as a control followed by treatment with nocodazole + calcium for 2, 4, or 8 h. Cells were immunostained for ECad, CLASP2, and α-tubulin. (D) Random individual plot profiles at cell–cell adhesion sites (n = 10 per cell/40–50 cells) were obtained for the different time points of nocodazole treatment. The maximum fluorescence intensity of ECad and CLASP2 for each profile was quantified and normalized to the control not treated with nocodazole. Data are represented as means ± SEM. ***, P < 0.0001, Mann–Whitney U for ECad; ***, P < 0.001, Student’s t test for CLASP2. (E) CLASP2 was immunoprecipitated from mKer treated with calcium for 10 h followed by treatment with nocodazole + calcium for 4 h. The immunoprecipitates (IP) were analyzed for CLASP2, p120, and ECad by immunoblotting. WB, Western blot. Bars: (A, main image) 7.5 µm; (A, inset) 2 µm; (B, main image, and C) 25 µm; (B, inset) 5 µm.

