Figure 8.
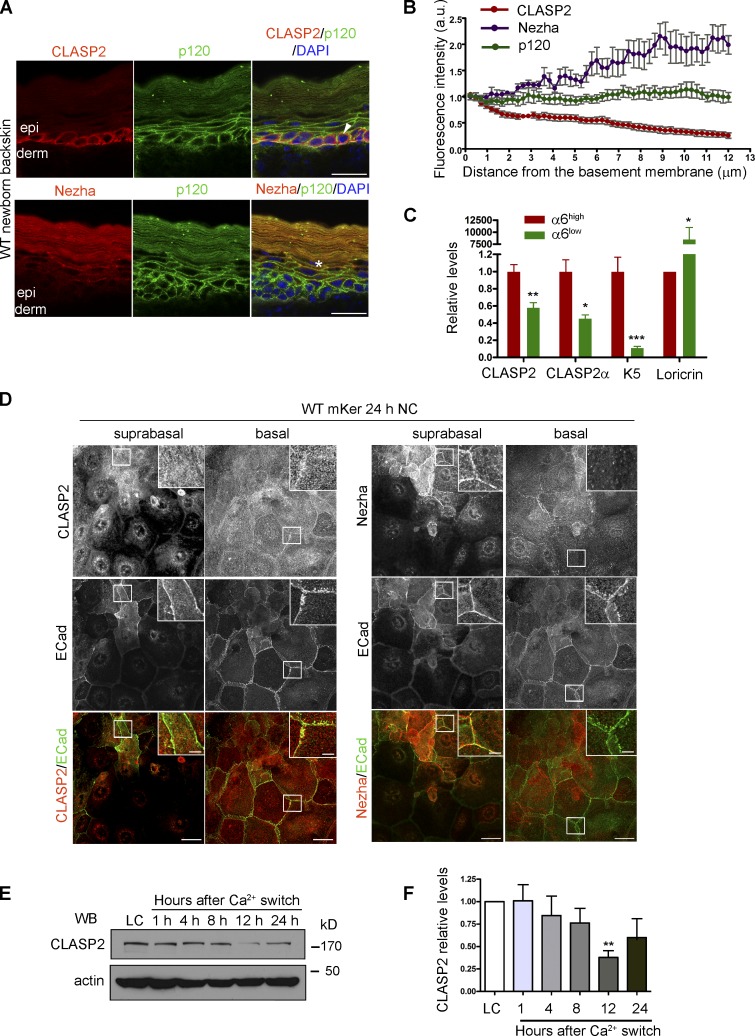
Differential distribution of CLASP2 and Nezha in the epidermis. (A) Back skins from WT newborn mice stained for CLASP2/p120 or Nezha/p120. The arrow denotes the basal distribution of CLASP2, and the asterisk indicates suprabasal Nezha localization. epi, epidermis; derm, dermis. (B) Quantification of CLASP2, Nezha, and p120 levels in the epidermis of newborn WT mice. Individual plot profiles were generated across the epidermis, and mean values of fluorescence intensity relative to those expressed at the basement membrane are shown. Data are represented as means ± SEM. (n = 3 mice, 30 plot profiles per mice per staining). a.u., arbitrary unit. (C) Real-time PCR analysis of mKer isolated from the back skin of newborn mice and FACS sorted according to their levels of α6 integrin into two populations: α6high (basal mKer) and α6low (suprabasal mKer). CLASP2 levels were analyzed with two different combinations of primers. Keratin 5 (K5) and loricrin were used as markers of basal and suprabasal mKer, respectively. For each primer pair, values were normalized to the transcript levels of the α6high population. Data are represented as means ± SEM; ***, P < 0.0004; **, P < 0.002; *, P < 0.03, Student’s t test. (D) WT mKer subjected to a 24-h calcium switch in vitro and immunostained for either CLASP2 or Nezha together with p120 and ECad. Insets are magnifications of the boxed regions. (E) Immunoblot analysis of CLASP2 levels in WT mKer subjected to a calcium-switch time course for the time points indicated in hours. LC, low calcium. (F) Quantification of CLASP2 levels observed by immunoblotting in D. n = 3 independent experiments. Data are normalized to LC values and represented as means ± SEM; *, P < 0.008, Student’s t test. Bars: (A and D, main images) 25 µm; (D, insets) 5 µm.

