Figure 3.
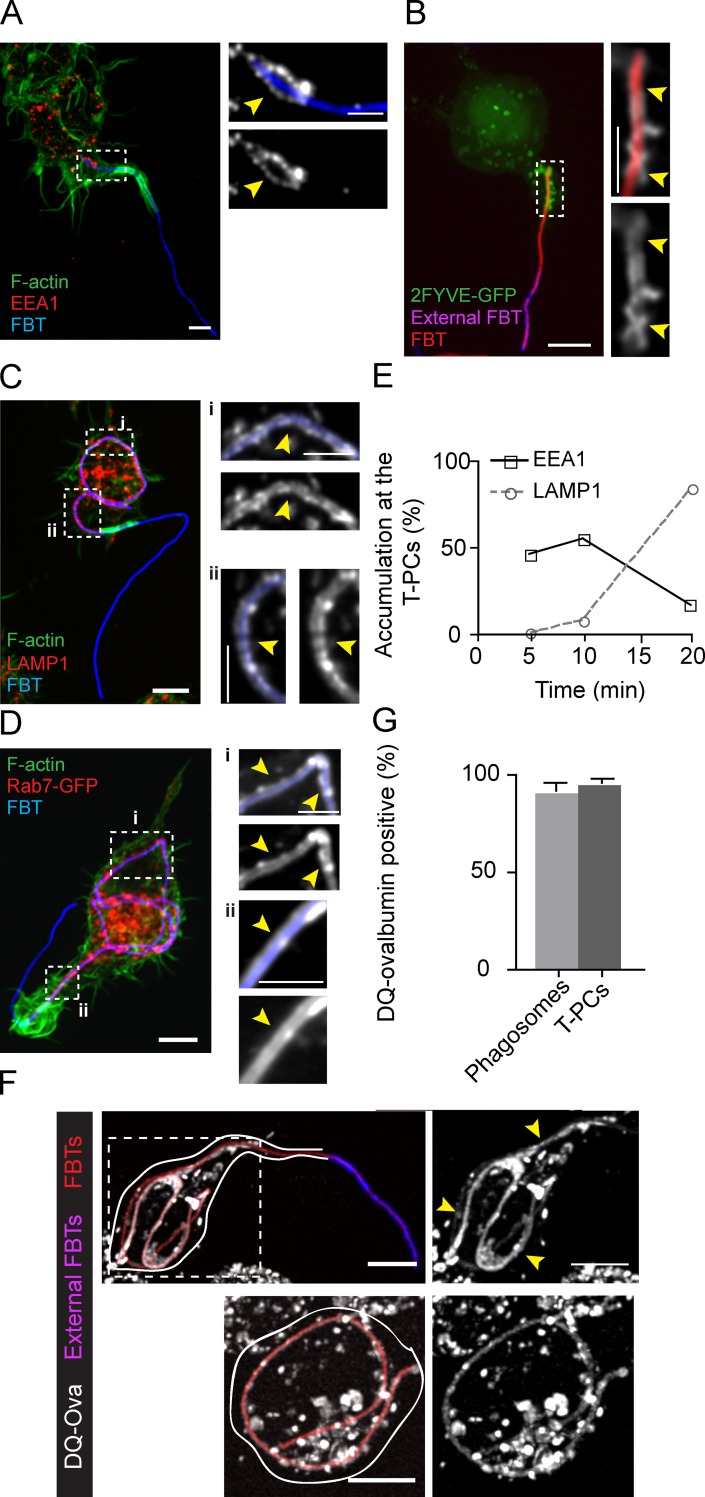
The T-PCs fuse with endosomal and lysosomal compartments. (A) EEA1 and F-actin distribution in cells after 5 min of phagocytosis. Right: magnified single planes from framed regions. Arrowheads indicate EEA1 recruitment (white) around FBT where F-actin (green) is lost from the base of the T-PC. (B) 2FYVE-GFP accumulation around FBT after 5 min of phagocytosis. Right: magnified single planes from framed regions. Arrowheads indicate the accumulation of 2FYVE (white) around internalized FBT segments. External FBT sections are shown in pink. (C) LAMP1 (red) localization around internalized FBTs, where actin (green) is lost from the base of the T-PC. Right: magnified single planes from framed regions. Arrowheads indicate LAMP1 accumulation (white). (D) Rab7-GFP (red) accumulation around internal FBT segments. FBTs were added to cells expressing Rab7-GFP, cells were fixed after 20 min of phagocytosis, permeabilized, and actin was stained with phallodin (green). Right: magnified single planes from framed regions. Arrowheads indicate Rab7 accumulation (white). (E) Accumulation of EEA1 or LAMP1 around internal FBT sections over time. Cells were immunolabeled for both EEA1 and LAMP1 and partially internalized FBTs were scored for the accumulation of these markers. Data shown are percentages from a representative experiment out of three repeats. For the data shown, n = 80 at each time point. Note: none of the FBTs were positive for both markers. (F) Lysosomes fuse with T-PCs. Cells preloaded with DQ-ova were allowed to ingest FBTs for 20 min. Cells were fixed and external FBTs were immunolabeled (pink). Top: DQ-ova accumulation (white) around internal parts of FBT (arrowheads). Right: higher magnification of the framed regions. Bottom: DQ-ova accumulation around fully internalized FBT (arrowheads). Solid lines delineate cell boundaries. (G) The number of partially and fully internalized FBTs surrounded by DQ-ova from (F). Data shown are means ± SEM from three independent experiments. At least 50 FBTs were analyzed in each case. Bars: (main panels) 5 µm; (magnifications) 2.5 µm.

