Figure 8.
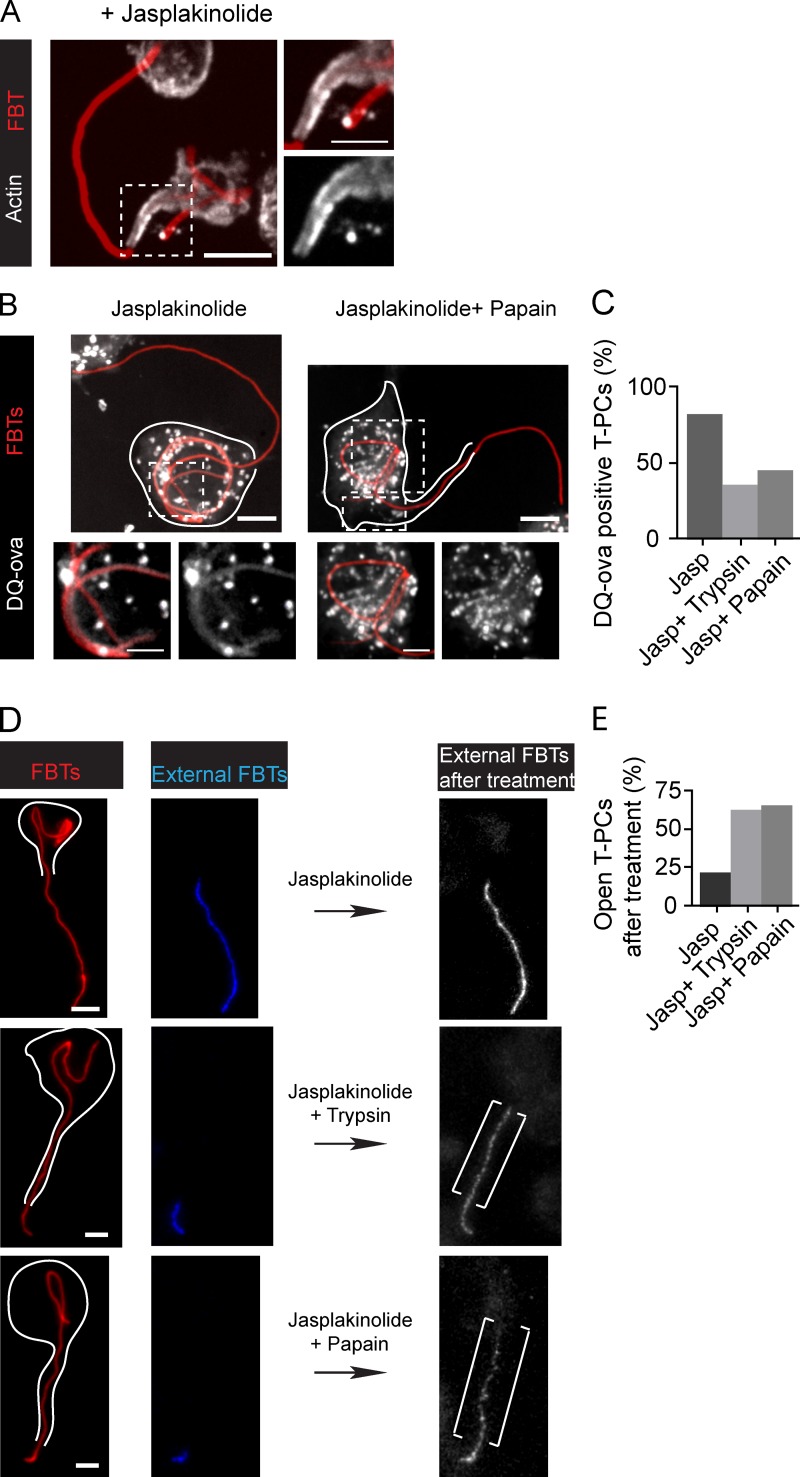
Molecular sieves form the barriers at the T-PCs. (A) After 20 min of phagocytosis, cells were treated with jasp and phagocytosis was allowed to continue (20 min). Actin was immunolabeled (white) to visualize jasp-stabilized actin jackets. Right: higher magnification of the framed region. (B) T-PCs become permeable to peptides derived from DQ-ova hydrolysis after treatment with externally applied proteases. 20 min after FBT phagocytosis in cells preloaded with DQ-ova, external FBT sections were labeled in the cold (not depicted). Cells were treated with jasp (20 min) followed by 20 min treatment with trypsin (not depicted) or papain (0.2 mg/ml) or left untreated. Bottom: magnified single planes from framed regions. (C) Number of T-PCs positive for DQ-ova from B. Data shown are percentages from a single experiment; n = 30. (D) T-PCs become permeable to externally applied antibodies after protease treatments. After 20 min of phagocytosis, external FBT sections were labeled, phagocytosis was allowed to proceed in the presence of jasp (20 min), and cells were then treated with trypsin or papain or left untreated for an additional 20 min. External sections of FBTs were labeled (white). Right: higher magnifications from framed regions. Brackets indicate antibody penetration after protease treatment. White lines indicate cell boundaries. (E) Number of T-PCs permeable to antibodies from D. Data shown are percentages from a single experiment, completed once (n = 50). All micrographs shown are merged z-planes (not deconvolved). Bars: (main panels) 5 µm; (magnifications) 2.5 µm.

