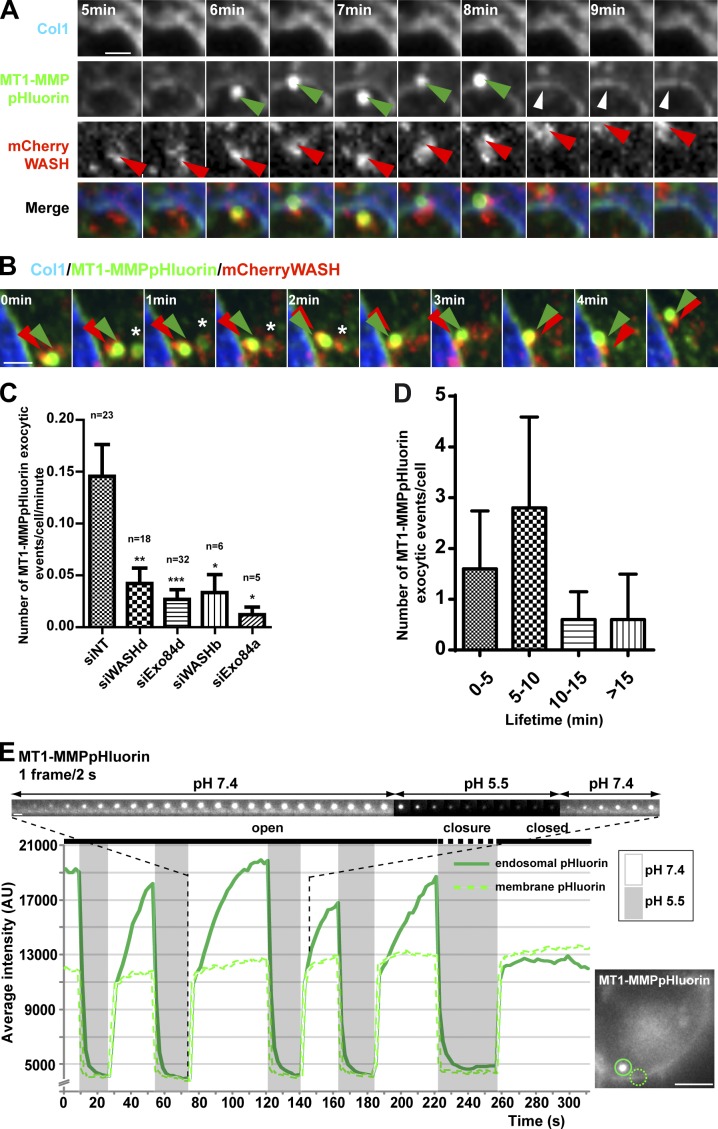
Figure 8.
A WASH- and Exo84-dependent exocytic mechanism of MT1-MMP involved in pericellular collagenolysis. (A and B) Live-cell imaging of MDA-MB-231 cells expressing MT1-MMPpHluorin (green) and mCherry-WASH (red) constructs, plated on a layer of collagen I for 30 min (see Video 6). The galleries show exocytosis of MT1-MMPpHluorin–positive endosomes (green arrowheads) in the vicinity of a collagen type I fiber (blue). These endosomes harbor WASH-positive patches (red arrowheads). The asterisks in B point the reacidification of a WASH- and MT1-MMPpHluorin–positive endosome. Time is represented in minutes. Bars, 2 µm. (C) MDA-MB-231 cells expressing MT1-MMPmCherry and MT1-MMPpHluorin silenced for the indicated proteins were seeded on a layer of type I collagen fibers and imaged over a 30-min time perios and the frequency of MT1-MMPpHLuorin exocytic events was quantified (box plots of events/cell/min). The number of cells analyzed for each cell population is indicated. *, P < 0.05; **, P < 0.01; ***, P < 0.001 (compared with siNT-treated cells). (D) Lifetime of MT1-MMPpHluorin–positive flashes (in minutes). Data show the number of pHLuorin exocytic flashes per cell for the different lifetimes ± SEM from five cells out of three independent experiments. (E) MDA-MB-231 cells expressing MT1-MMPpHluorin were cultured on a layer of Cy3-labeled type I collagen fibers and subjected to external pH shifts alternating between 7.4 (white zones) and 5.5 (gray zones). The plots represent pHLuorin intensity of a MT1-MMP–positive endosome that underwent exocytosis (circled with a solid line in the inset on the right) and of a region of the plasma membrane (dashed line). The corresponding time-lapse series is shown in Video 7. The gallery above the plot represents a sequence starting with external pH 7.4 corresponding to the circled MT1-MMPpHLuorin–positive endosome (see inset). Bars: (inset) 5 µm; (gallery) 1 µm.

