Figure 5.
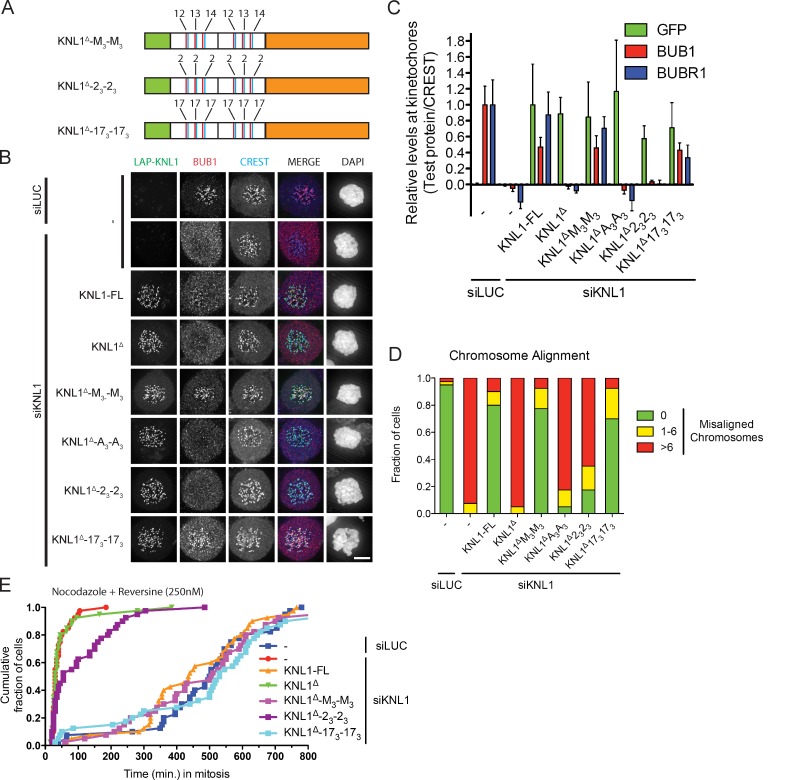
TΩ-MELT modules in KNL1 are redundant and exchangeable. (A) Schematic representation of synthetic LAP-KNL1 constructs. For color codes, see Fig. 4 A. See main text for details about constructs. (B and C) Representative images (B) and quantification (C) of LAP-KNL1–expressing Flp-in HeLa cells transfected with siRNAs to luciferase (siLUC) or to KNL1 (siKNL1) and treated with nocodazole. LAP-KNL1 is shown in green, BUB1 in red, centromeres (CREST) in blue, and DNA (DAPI) in white. Bars, 5 µm. Quantification in C shows total kinetochore signal intensity (+SD) of LAP-KNL1 and BUB proteins over CREST. Data are from >15 cells and representative of 3 experiments. Levels of kinetochore BUBs in control cells and of kinetochore LAP-KNL1 in KNL1-FL–expressing cells are set to 1. (D) Quantification of chromosome alignment in Flp-in HeLa cells expressing LAP-KNL1 variants, transfected with siLUC or siKNL1, and treated with MG132 for 45 min. The data shown are from a single representative experiment out of three repeats. For the experiment shown, n = 40. (E) Time-lapse analysis of Flp-in HeLa cells expressing LAP-KNL1 variants, transfected with siLUC or siKNL1, and treated with nocodazole and 250 nM reversine. Data (n = 40 representative of 3 independent experiments) indicate cumulative fraction of cells that exit from mitosis (as scored by cell morphology using DIC) at the indicated time after NEB.

