Figure 5.

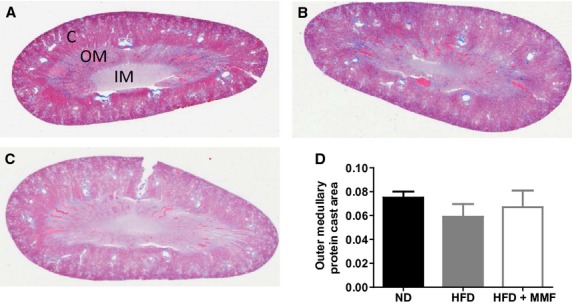
Representative renal medullary protein casts from SS rats on (A) normal diet (ND) (N = 5), (B) high-fat diet (HFD) (N = 5), and (C) HFD treated with (+) MMF (N = 5). Bar represents 100 μm.

Representative renal medullary protein casts from SS rats on (A) normal diet (ND) (N = 5), (B) high-fat diet (HFD) (N = 5), and (C) HFD treated with (+) MMF (N = 5). Bar represents 100 μm.