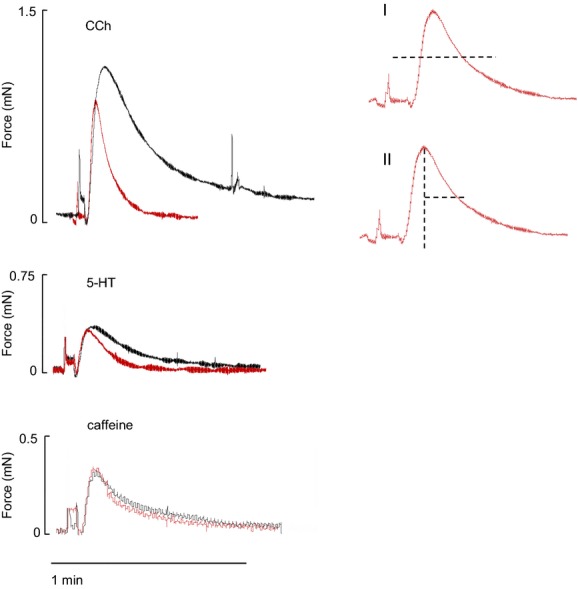
Figure 2.

Duration of response to CCh (upper), 5-HT (middle), and caffeine (bottom), cftr+/− responses are shown in black and cftr−/− responses in red. Calculation of duration at 50% peak amplitude is shown in I, and the half time of relaxation (time taken to relax to half peak amplitude (t1/2) is shown in II).
