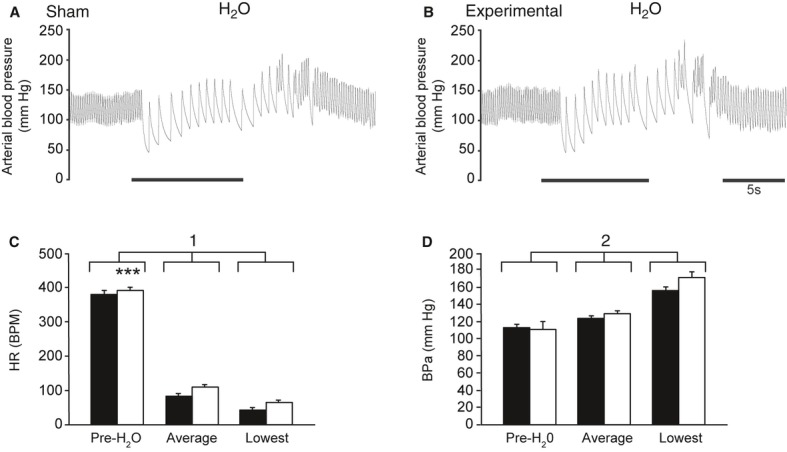
Figure 4.

Original pulsatile arterial blood pressure traces in (A) Sham and (B) Experimental rats anesthetized with urethane during nasal stimulation with water. In Sham rats, the AENs were isolated but were not cut. In Experimental rats, the AENs were cut bilaterally. Solid bars indicate periods of nasal stimulation. (C) Mean HR (±SE) responses from Sham and Experimental rats before nasal stimulation (Pre-H2O), and the average and lowest HR during nasal stimulation. (D) Mean BPa (±SE) responses from Sham and Experimental rats before nasal stimulation (Pre-H2O), and the average and highest BPa during nasal stimulation. Filled bars = Sham; Open bars = Experimental. 1 = Pre-H2O, average and lowest HR were significantly different from each other, as indicated by a two-way repeated measures ANOVA. *= HR responses from Sham and Experimental rats were significantly different from each other, as indicated by the two-way repeated measures ANOVA. 2 = Pre-H2O, average, and highest BPa were significantly different from each other, whereas the responses from Sham and Experimental rats were not significantly different from each other, as indicated by a two-way repeated measures ANOVA.
