Figure 2.

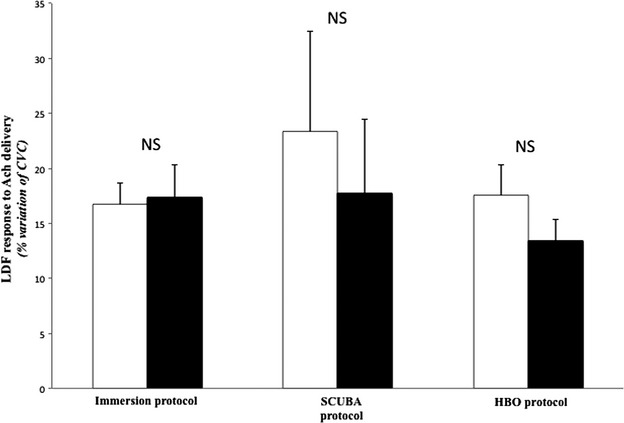
Laser Doppler Flowmetry expressed as a percentage (mean ± SEM) of CVC response to acetylcholine (ACh) iontophoresis stimulation, before (white bars) and after (black bars) each of three protocols (n = 10).

Laser Doppler Flowmetry expressed as a percentage (mean ± SEM) of CVC response to acetylcholine (ACh) iontophoresis stimulation, before (white bars) and after (black bars) each of three protocols (n = 10).